State of BNB Chain Q4 2025

Key Insights
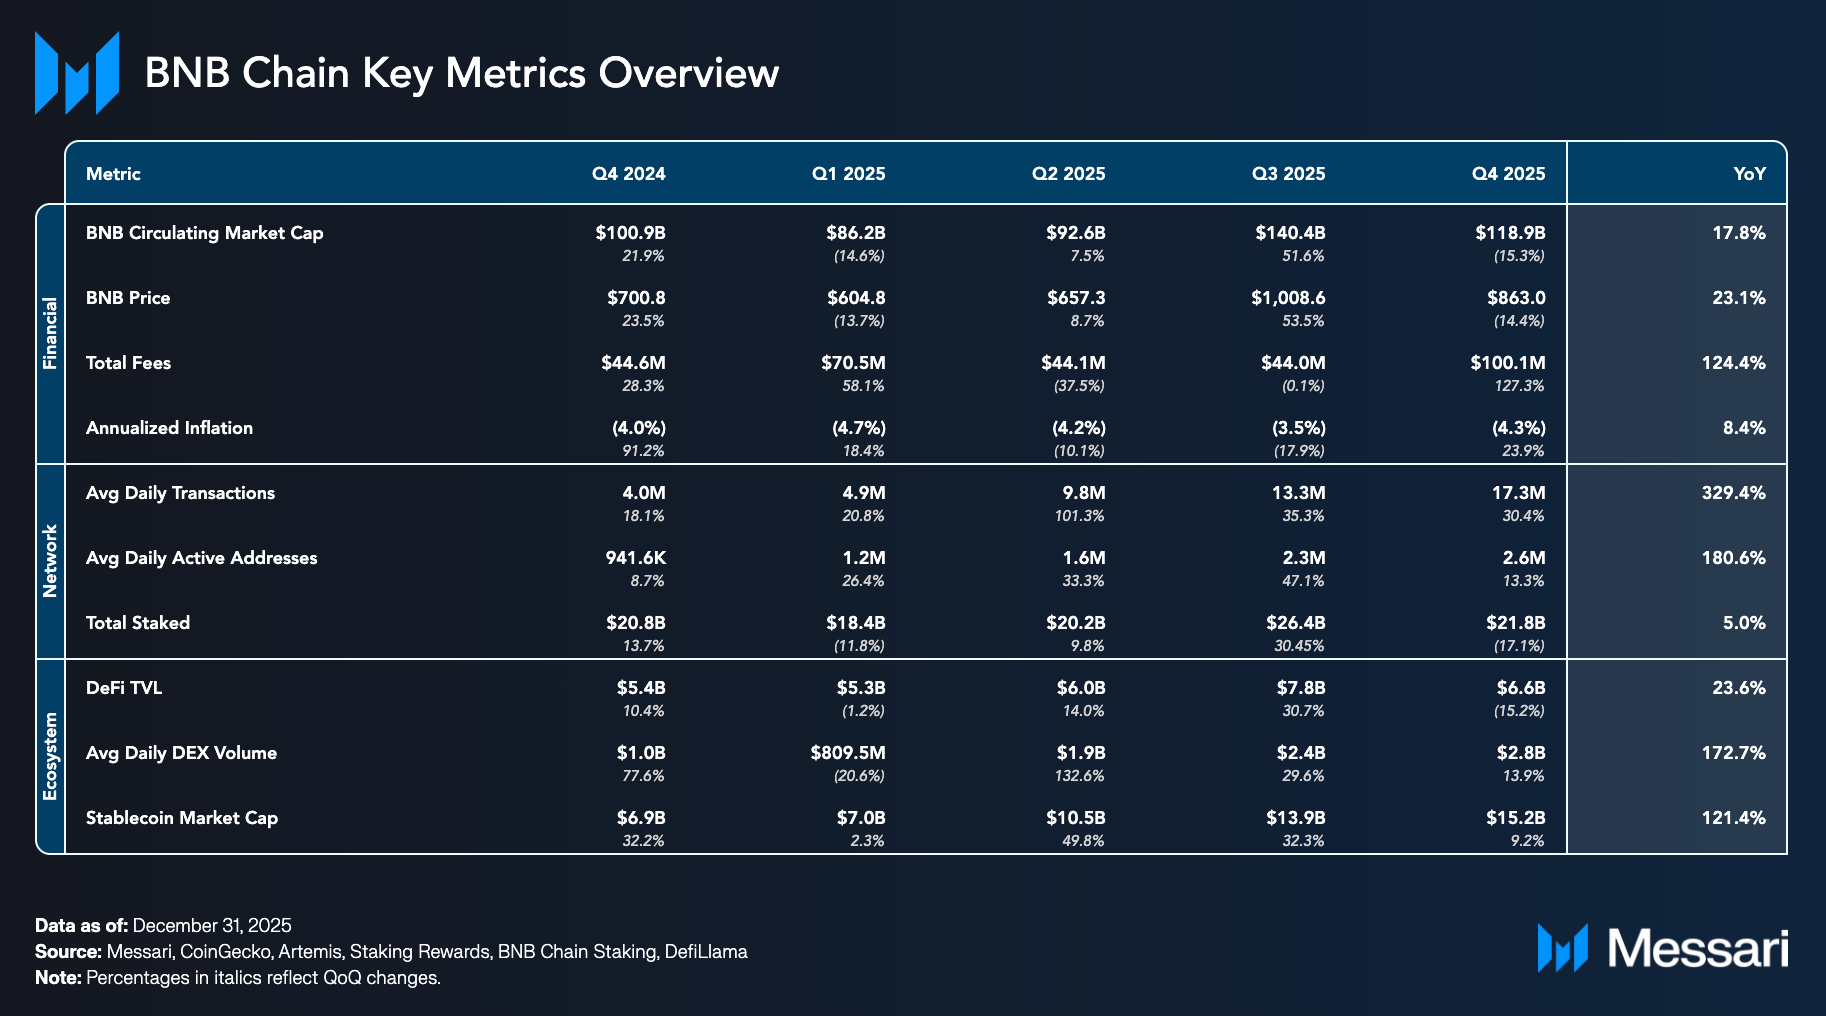
- BNB finished the year at $863 with a $118.9 billion circulating market cap, up 17.8% YoY. This makes the BNB the third-largest cryptocurrency by market cap, excluding stablecoins.
- Average daily transactions rose 30.4% QoQ to 17.3 million, while daily active addresses increased 13.3% to 2.6 million.
- BNB Chain remained the third-largest network by DeFi TVL. The network ended the year with $6.6 billion in TVL across its ecosystem, down 15.2% QoQ but up 23.6% YoY. PancakeSwap remained the largest DeFi product, with $2.2 billion in total value locked.
- Total RWA value grew to $2.0 billion, up 228.1% QoQ, and up 554.6% YoY from $3.6 million at the beginning of the year. Growth was driven by large institutional deployments such as USYC and BUIDL, while partnerships with Ondo Global Markets and CMB International offer to bring more longtail assets onchain.
- Stablecoin market cap increased 9.2% QoQ to $15.2 billion, led by USDT and USDC, while initiatives like the Better Payment Network partnership and the launch of $U emphasized payments and liquidity efficiency over speculative issuance.
Primer
BNB Chain (BNB) is an ecosystem of blockchains where each chain serves a particular function. The three core components of BNB Chain are as follows:
- BNB Smart Chain (BSC): Smart contract layer and DeFi hub. Since its merge with BNB Beacon Chain, BSC also serves as the staking and governance layer.
- BNB Greenfield: Decentralized storage network. As a vital component of the One BNB paradigm, Greenfield focuses on live, valuable data and lets users create their own personal data marketplace.
- opBNB: High-performance optimistic rollup. opBNB is ideal for Dapps that require high transaction frequency, like fully onchain games. It offers low gas fees, with transactions costing <$0.0001, as well as very high performance, processing between 5,000 and 10,000 TPS.
The metrics in this report will mostly focus on BNB Smart Chain (BSC). BSC is an EVM-compatible, Layer-1 blockchain secured by a form of Proof-of-Staked-Authority (PoSA) that combines aspects of Proof-of-Authority (PoA) and Delegated Proof-of-Stake (DPoS). In PoSA on BSC, the validator set is of fixed size and is elected by stake weight (staked plus bonded). In addition, validators must continue staking assets to secure the network, and validators chosen to produce blocks are rotated (not based on stake weight).
Website / X (Twitter) / Telegram
Key Metrics
Financial Overview
Market Cap and Price
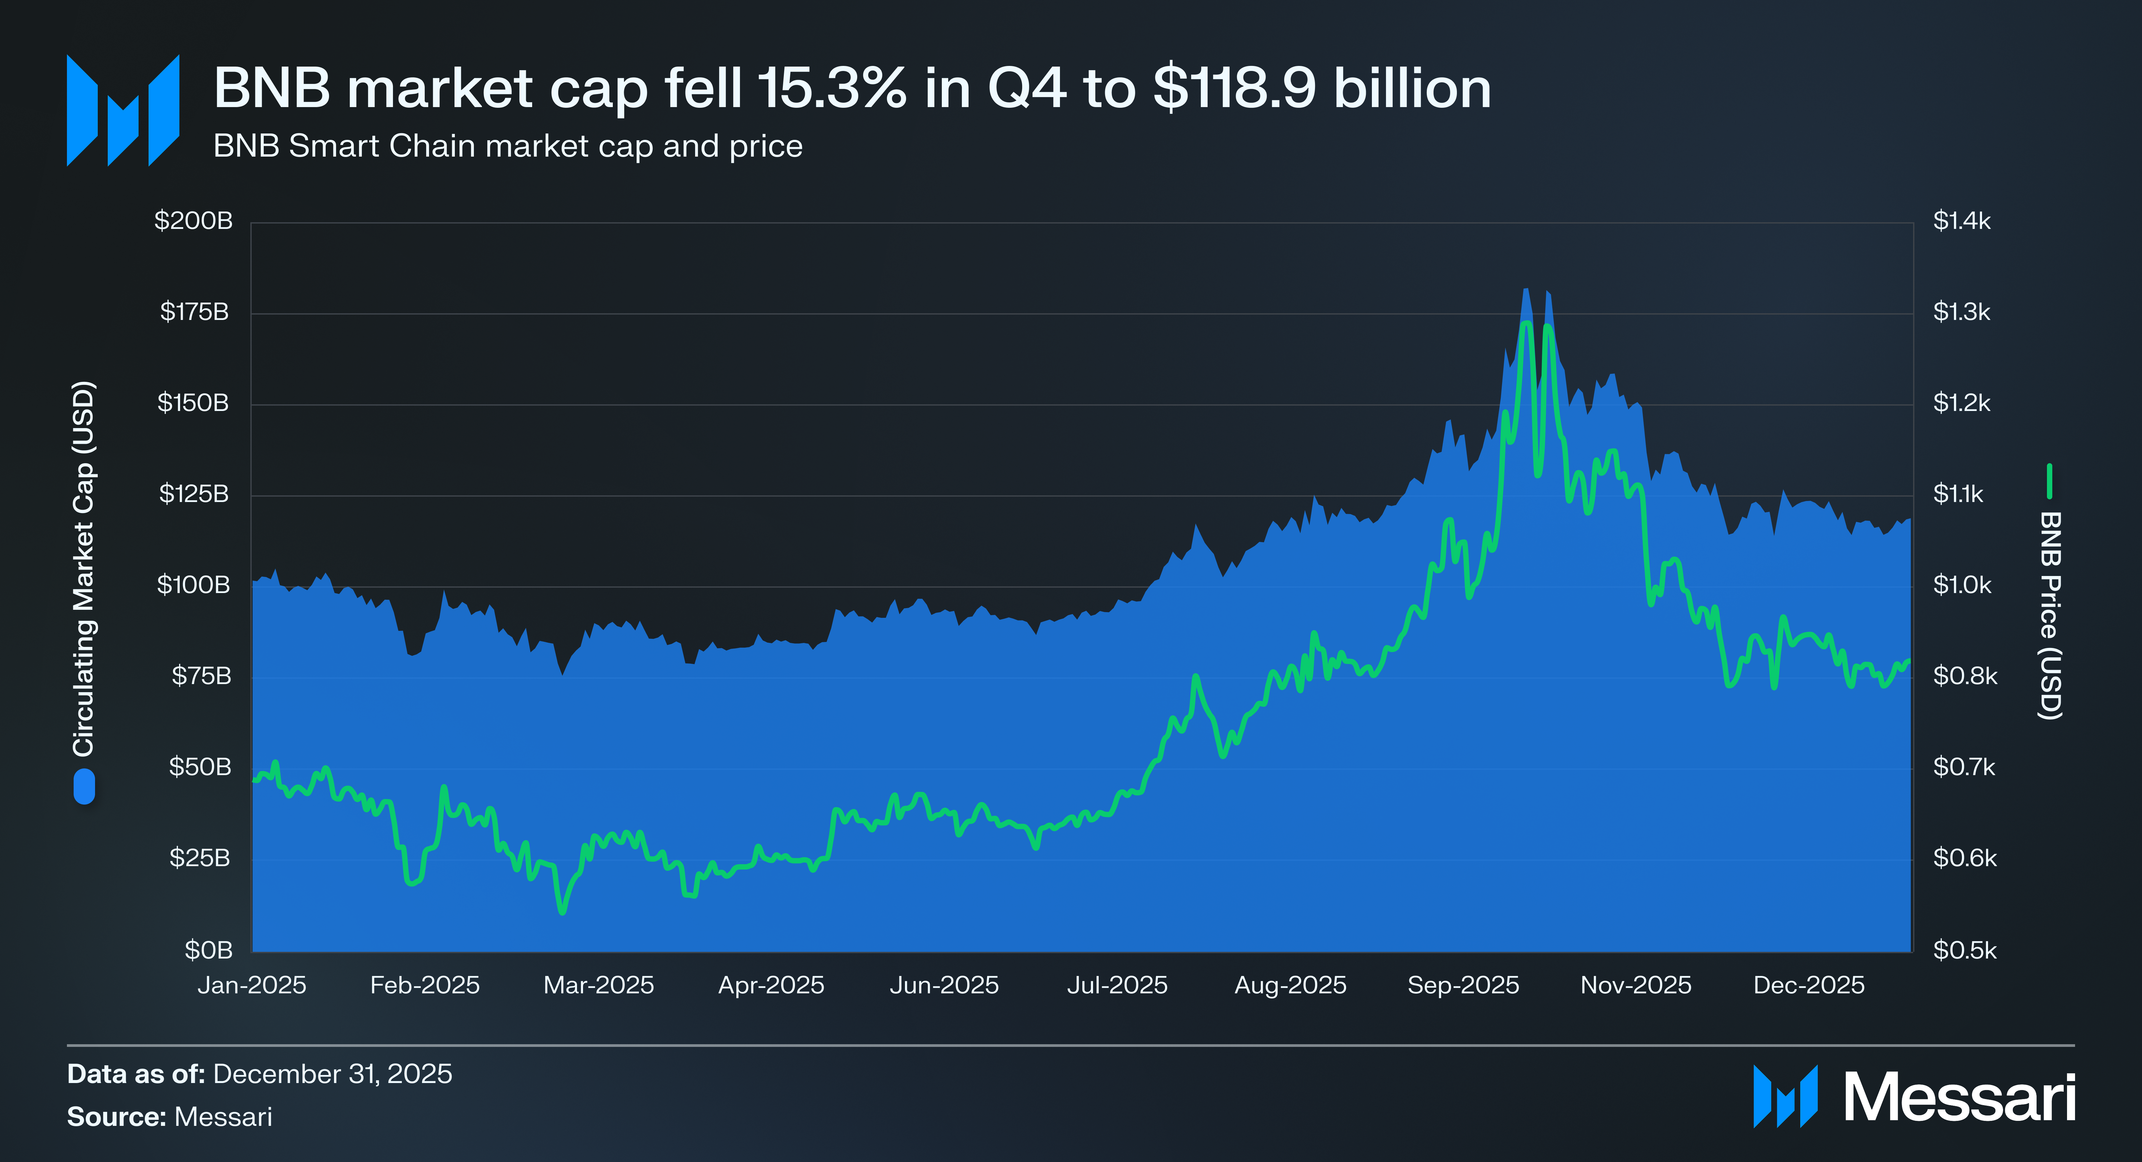
BNB’s circulating market cap fell 15.3% QoQ to $118.9 billion in Q4 2025. BNB’s token price also dropped, falling 15.3% QoQ to $863. On October 11, the industry experienced a massive liquidation event that affected crypto prices, including BNB, which, after an all-time high of $1,370 on October 13, began a gradual decline. Despite the volatility, BNB finished the quarter as the third-largest cryptocurrency by market cap, excluding stablecoins, and surpassing XRP in the rankings. BNB’s end-of-quarter market cap only trails Bitcoin and Ethereum.
Fees
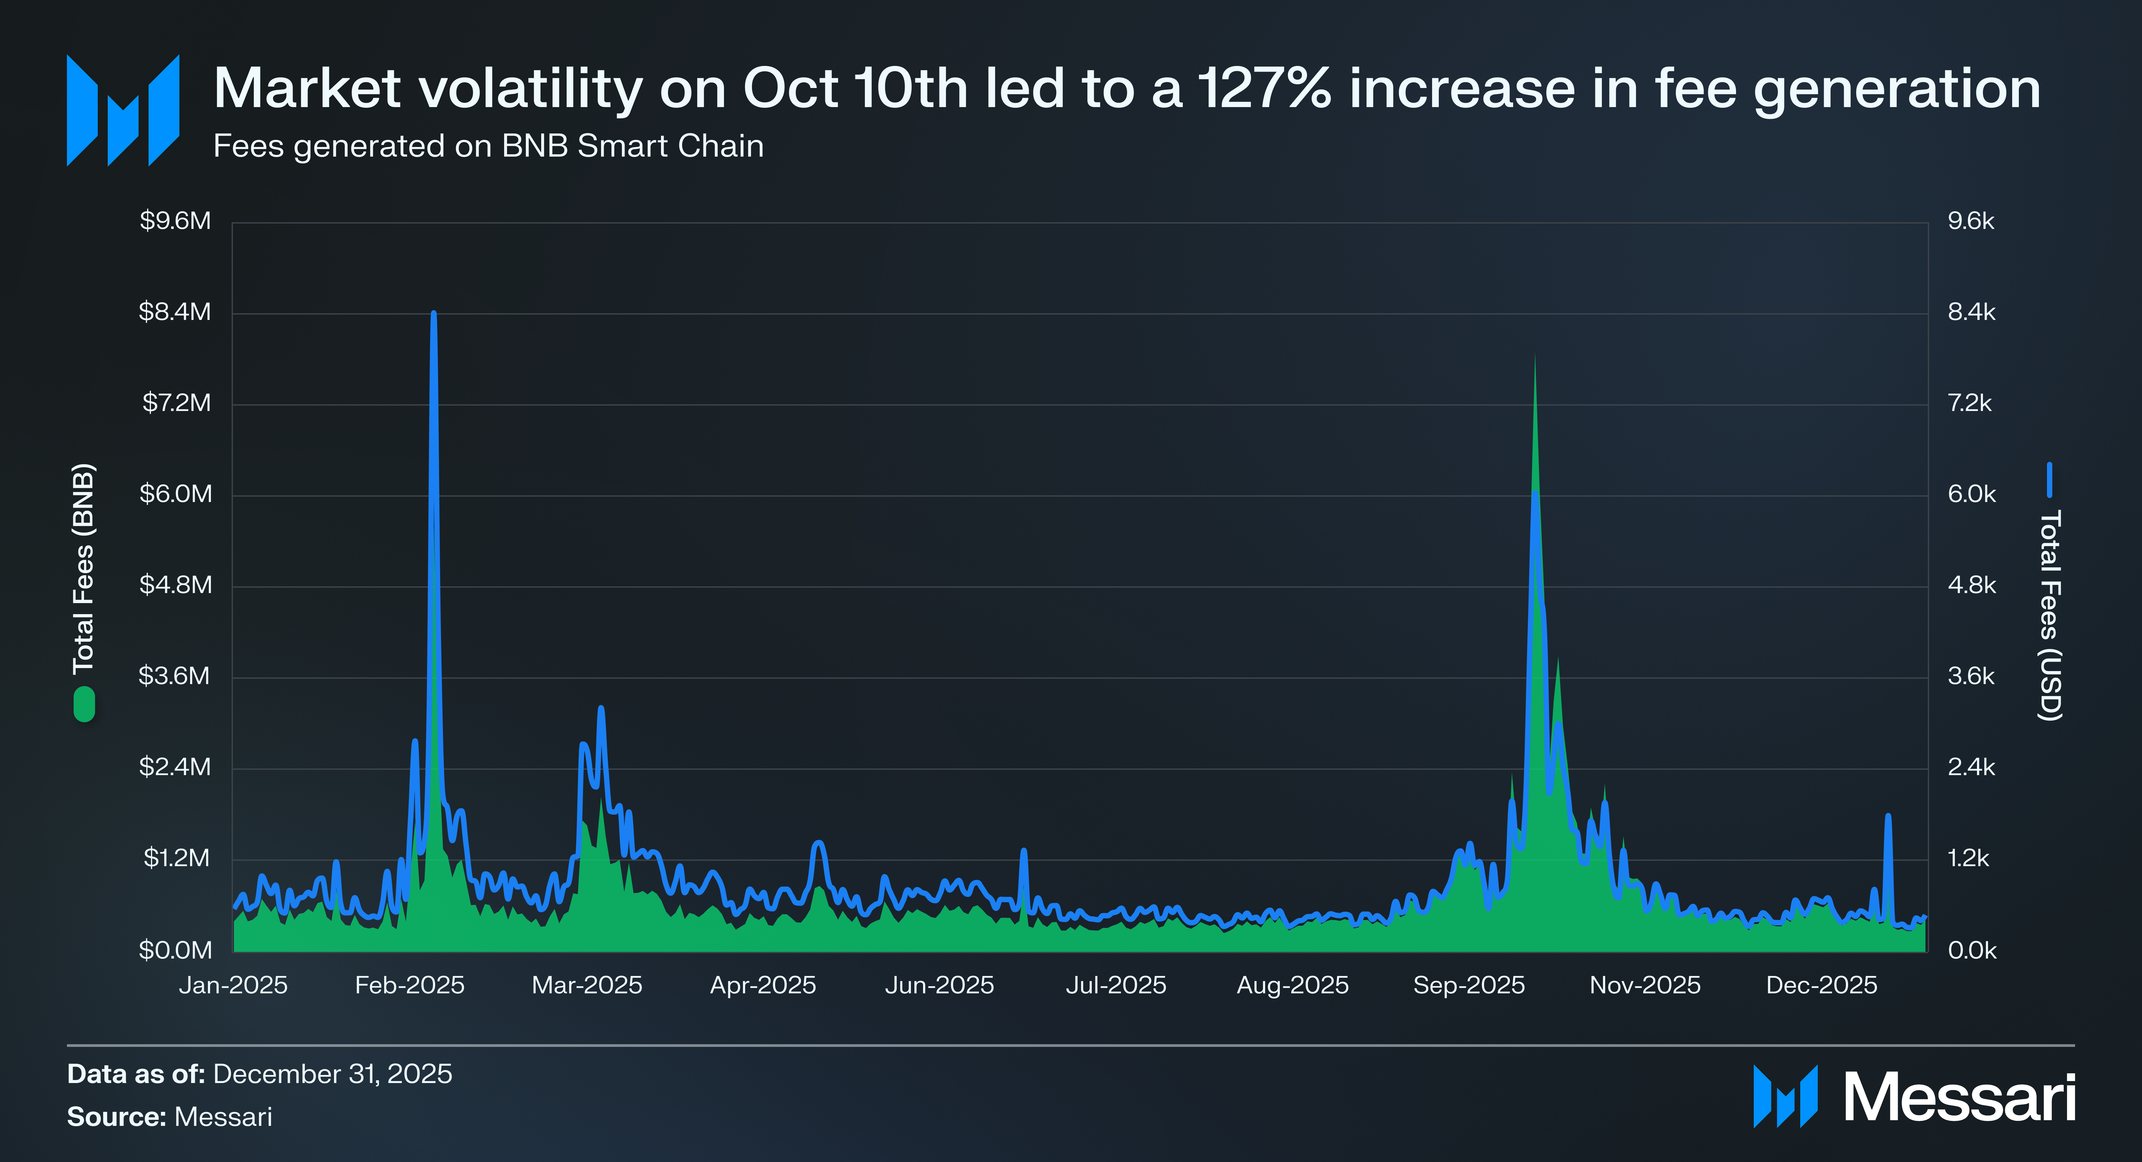
BNB Chain’s fee generation rebounded sharply in Q4 2025, with total fees reaching $100.1 million, up 127.3% QoQ from $44.0 million in Q3. This marked the highest quarterly fee total of the year and a clear break from the relatively flat fee environment observed through the middle of 2025.
The majority of Q4’s fee growth was concentrated in a short window around October 11, when heightened market volatility triggered a cascade of liquidations across onchain venues. The resulting spike in trading activity, liquidations, and arbitrage flows temporarily increased demand for blockspace, driving a surge in transaction fees. Outside of this volatility-driven period, however, baseline fee generation remained more consistent with Q3 levels.
Supply Dynamics
The initial total token supply for BNB was 202 million tokens (launched in July 2017). BNB is deflationary through a series of burning mechanisms:
- Auto-Burn: A mechanism that automatically burns varying amounts of BNB every quarter, depending on the token’s price and the number of blocks generated on BNB Chain during said quarter.
- Pioneer Burn: A program that counts all BNB accidentally lost by new or careless BNB Chain users as part of the quarterly burns. The project team reimburses users for accepted cases.
- Gas Fees Burn: In accordance with BEP-95, 10% of all gas fees incurred on BNB Chain are burned automatically. The remaining 90% is rewarded to validators and stakers.
After the 33rd BNB Burn on October 27, 2025, the circulating supply of BNB was 137.7 million, giving BNB an annualized deflation rate of 4.3% (up 23.9% QoQ). In this burn, 1.4 million BNB was burned at a price of $1,208 per BNB, equivalent to $1.7 billion at the time of the burn transaction.
Network Overview
Onchain Activity
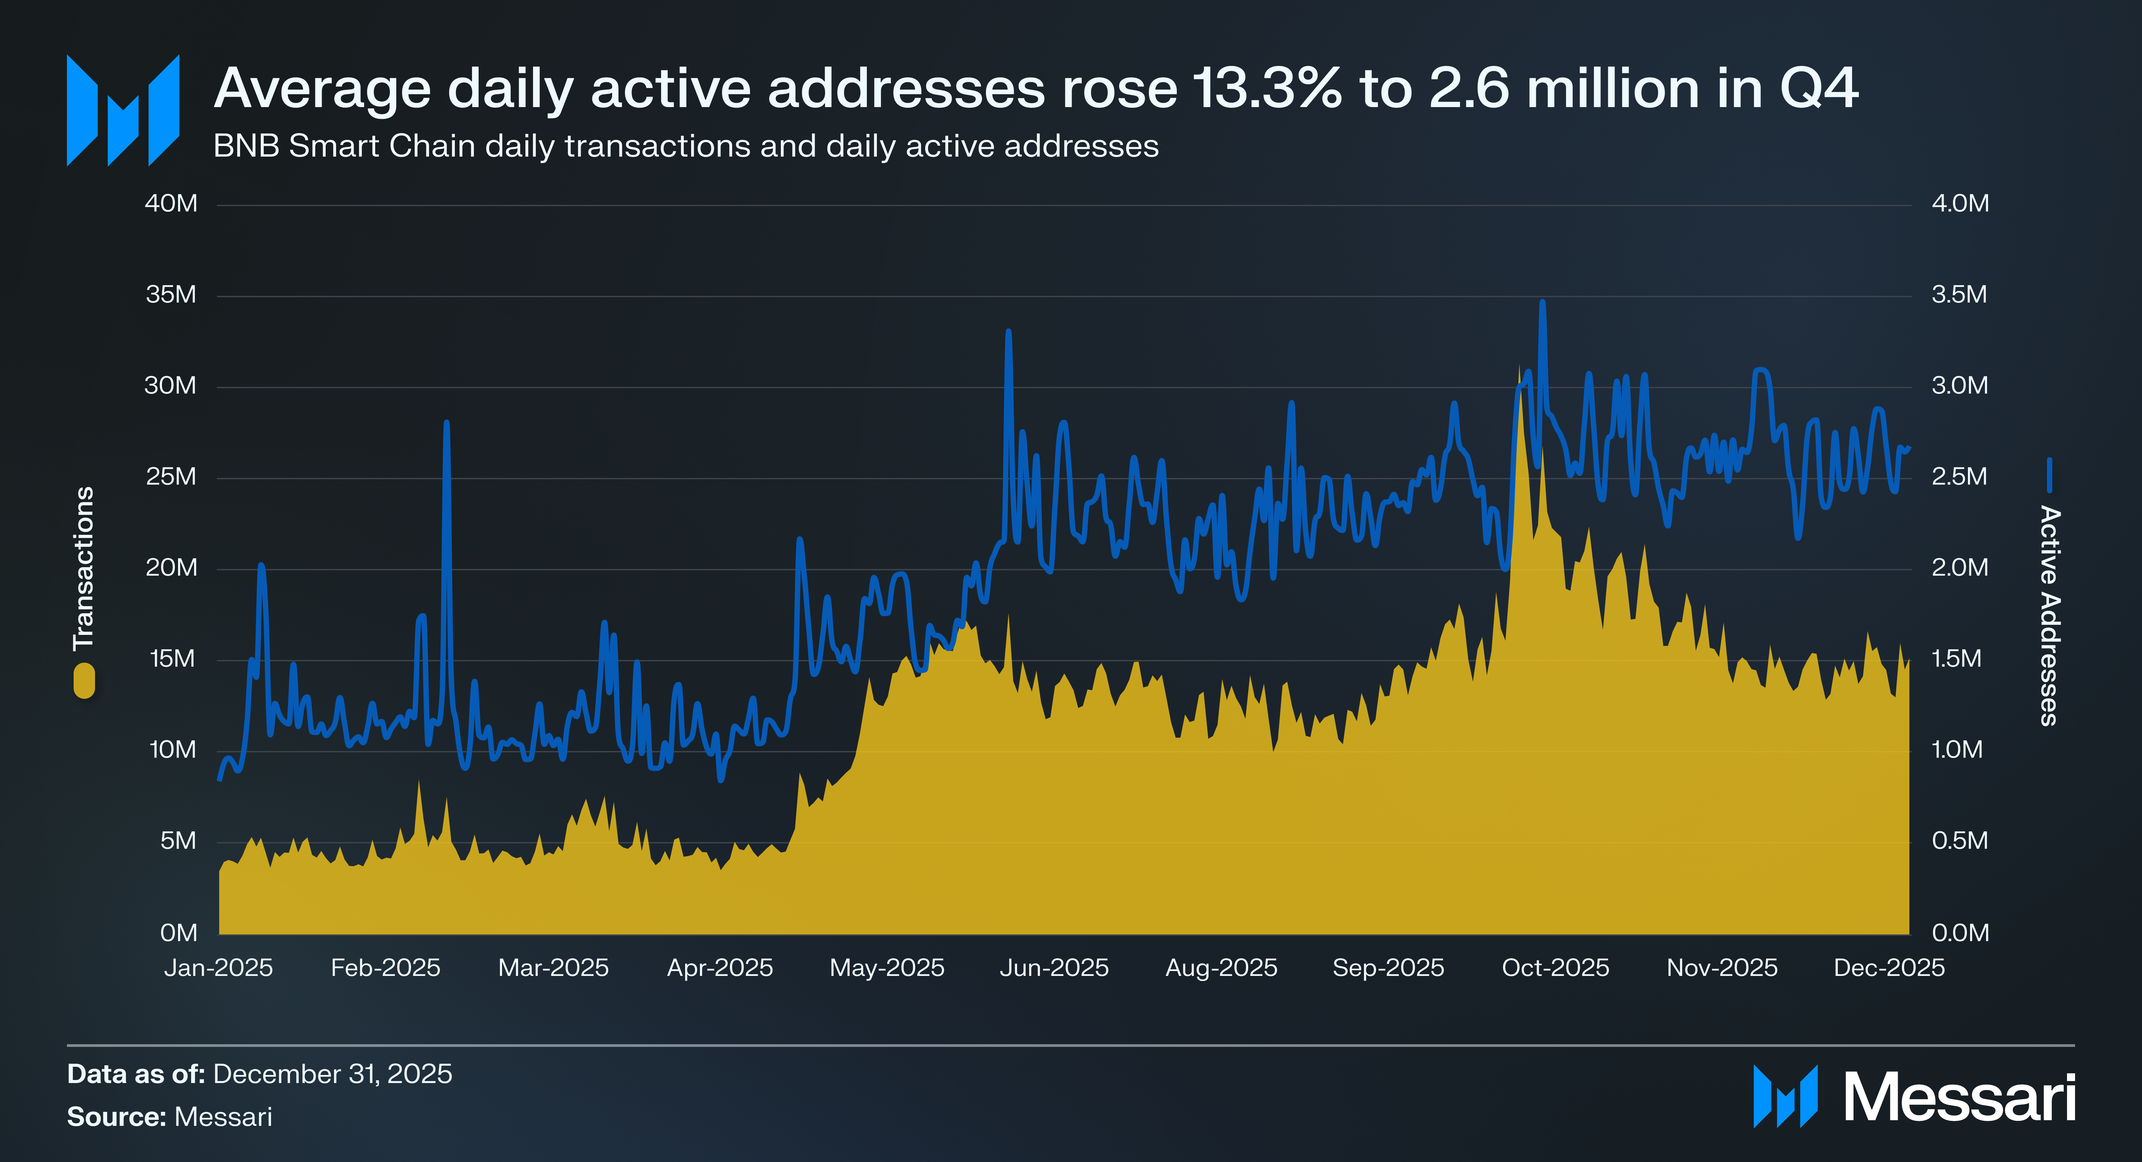
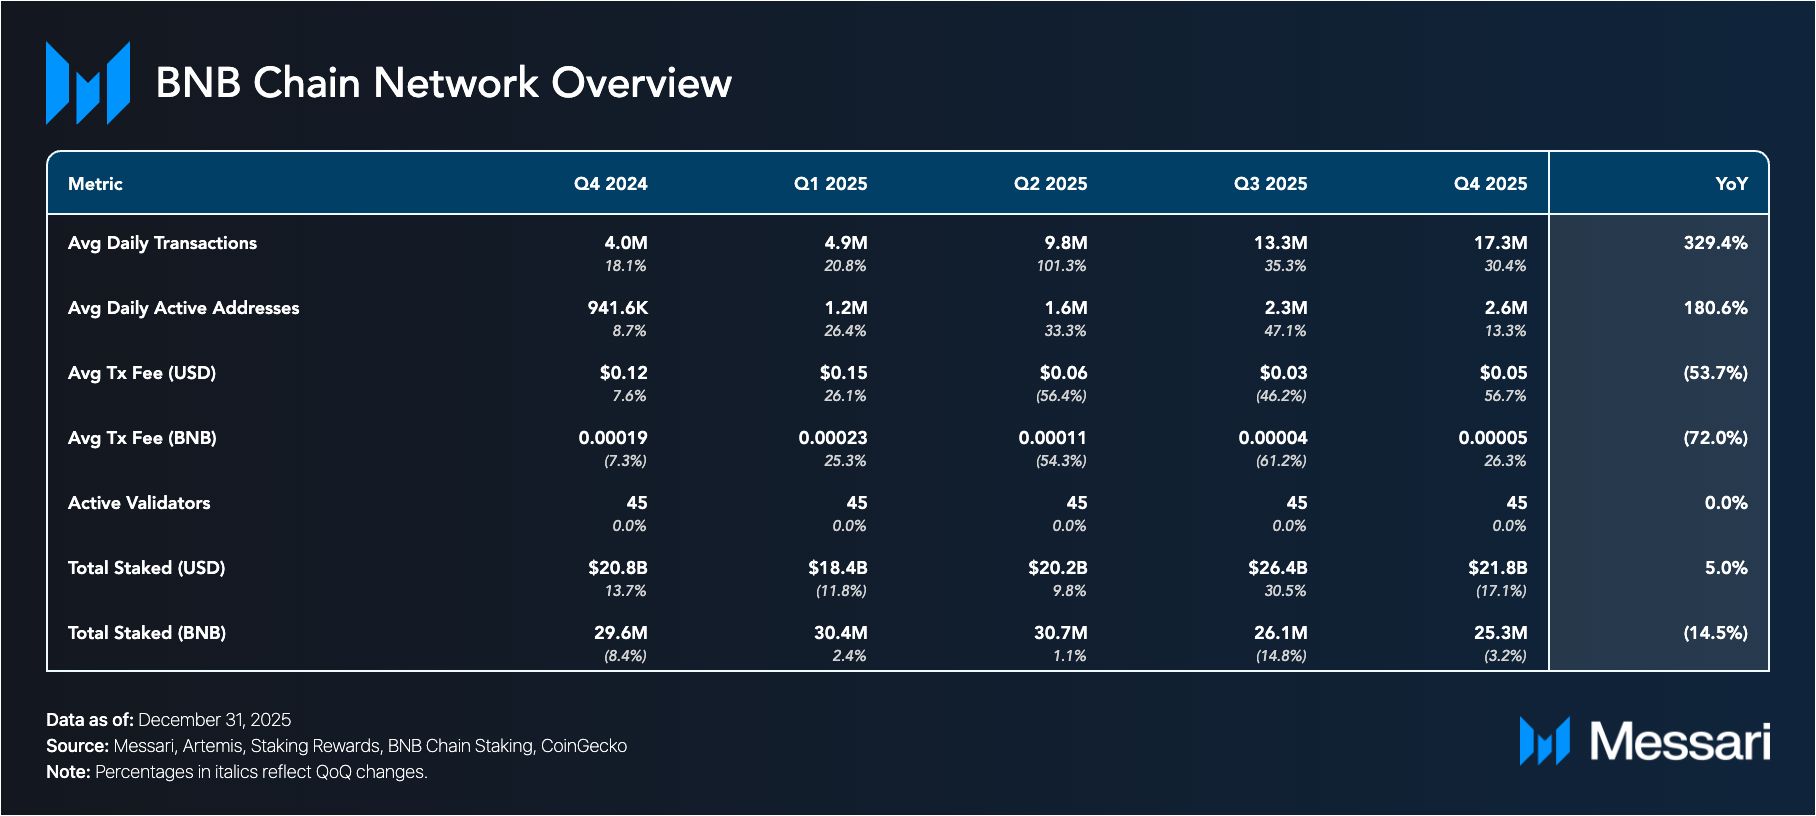
BNB Chain recorded an increase in onchain activity during Q4 2025, with average daily transactions rising to 17.3 million, up 30.4% QoQ from 13.3 million in Q3. Average daily active addresses also rose, reaching 2.6 million, a 13.3% QoQ increase from 2.3 million in Q3. The increase can be attributed in part to the spike in activity following the volatility in early October. However, excluding the spike, onchain activity still remains higher in Q4 than in Q3, meaning BNB’s ecosystem continues to attract new users.
Security and Decentralization
BNB Chain uses a Proof-of-Staked Authority (PoSA) consensus mechanism. Every 24 hours, 45 validator nodes are elected based on the total amount of BNB staked to each node. The top 21 nodes by stake are designated as "Cabinets," while the remaining 24 are considered "Candidates." For each epoch, 18 of the 21 Cabinets and 3 of the 24 Candidates are randomly chosen to produce blocks. These selected validators take turns producing blocks using a system modeled on Ethereum’s Clique consensus protocol.
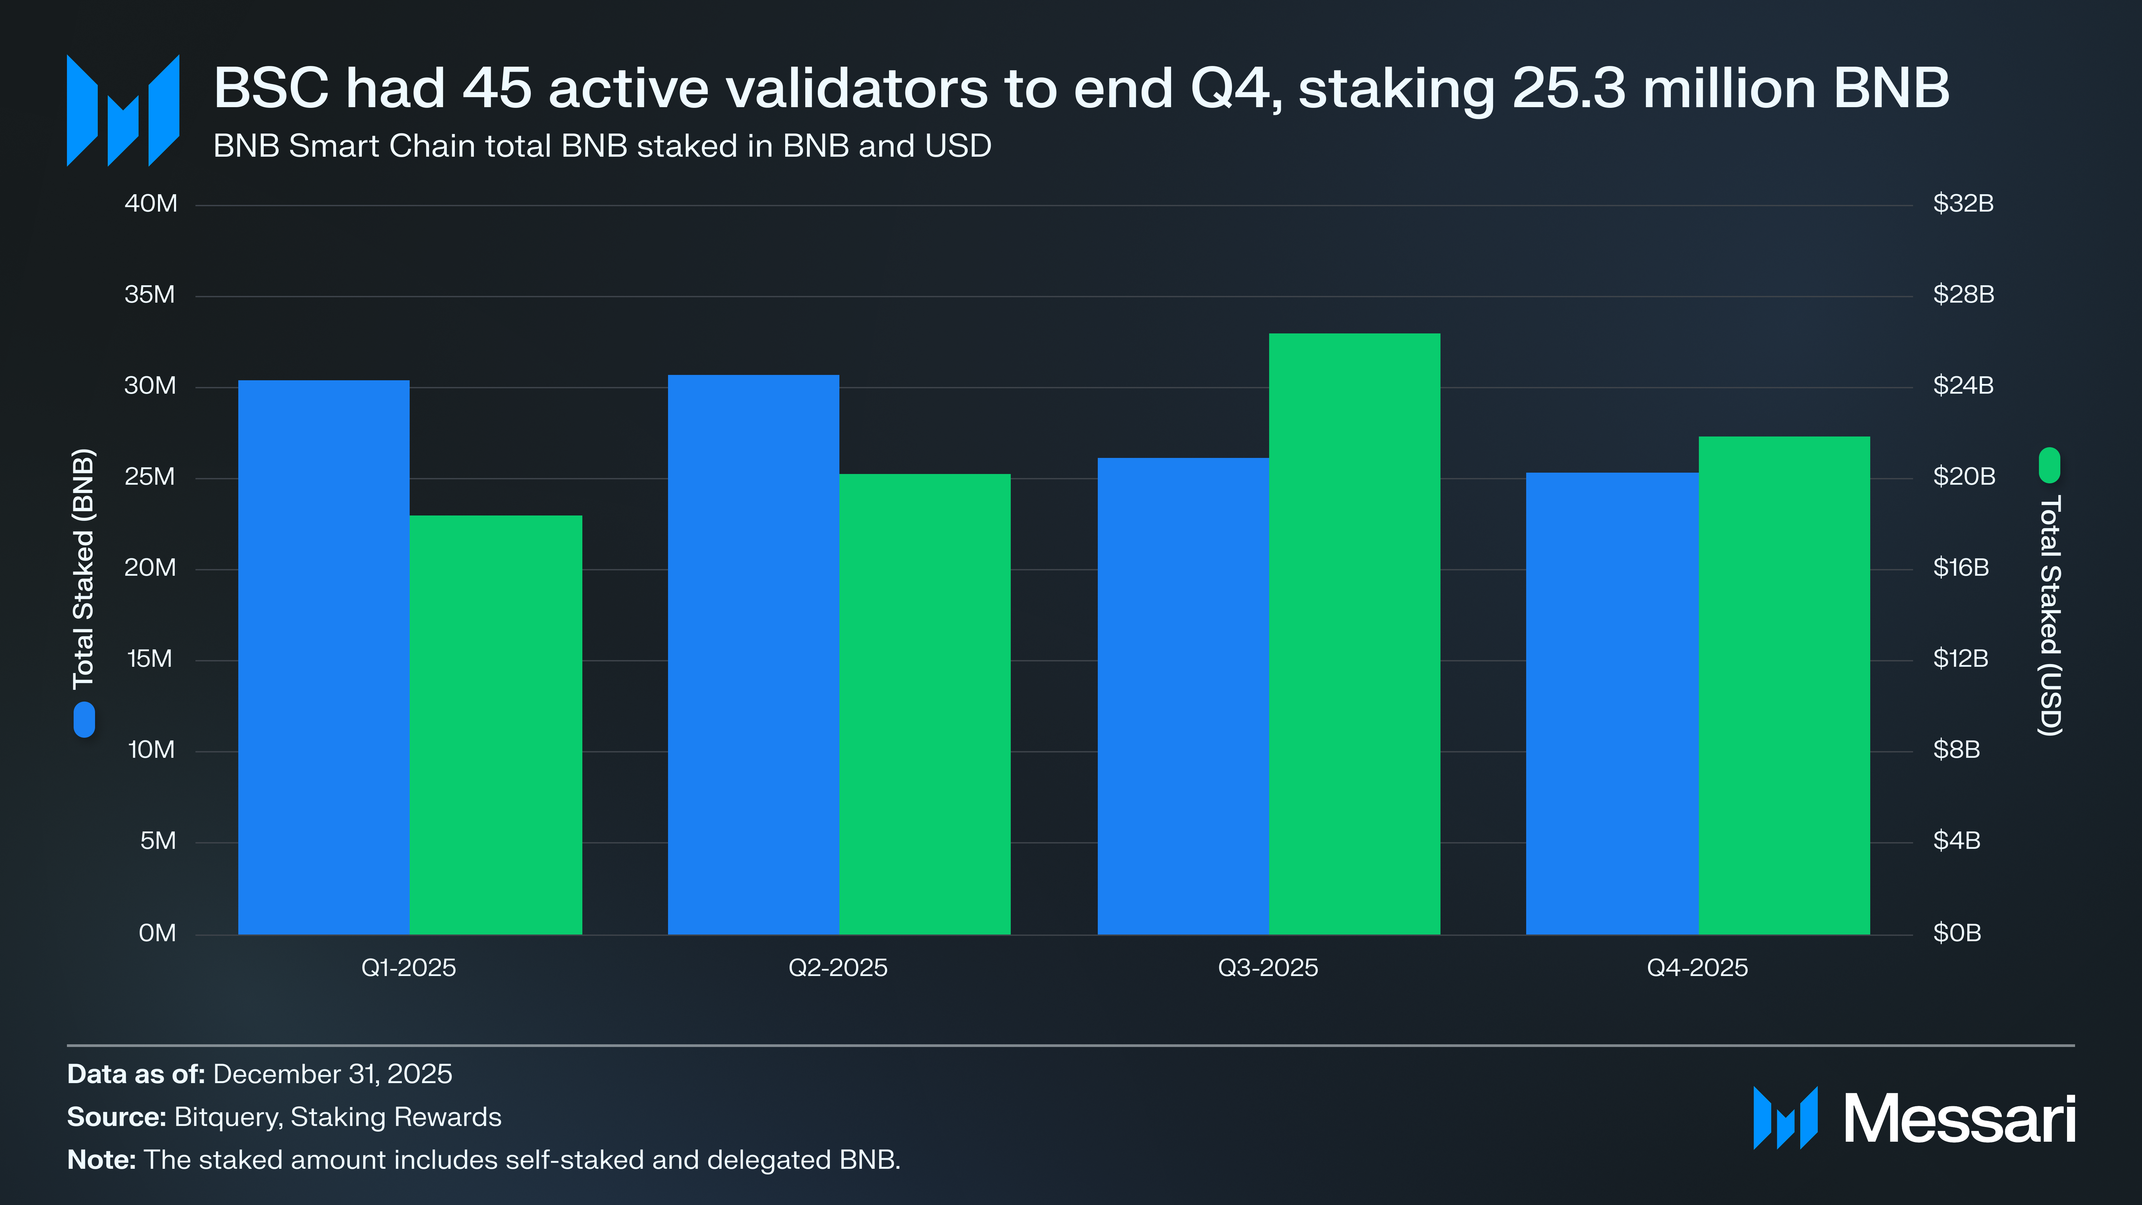
BNB Smart Chain maintained its full validator set of 45 active validators throughout Q4 2025, extending an uninterrupted streak that has held since the Feynman Upgrade increased the validator cap in April 2024.
Total staked BNB declined during the quarter, falling from 26.1 million BNB in September to 25.3 million BNB by the end of December, down 3.2% QoQ. In USD terms, the total value staked dropped 17.1% QoQ to $21.8 billion. The decline follows the drop in BNB’s token price throughout the quarter and signals that stakers are selling their stake or rotating capital toward higher-yield opportunities. Compared to other PoS networks, BNB Chain had the third-highest dollar value of funds staked by the end of Q4, behind Ethereum and Solana.
Protocol Upgrades
BNB Chain continued to implement execution and consensus-level optimizations in Q4, with a focus on reducing execution overhead and improving block processing efficiency. Specific upgrades include:
- Scalable DB: Announced on October 17, 2025, Scalable DB is a redesign of BNB Smart Chain’s data architecture aimed at addressing rapid long-term state growth and single-database I/O bottlenecks. The upgrade introduces a horizontally scalable, multi-database storage model combined with state sharding, distributing data across specialized databases to reduce compaction overhead, improve parallel I/O, and increase read and write efficiency. Scalable DB improves validator operability and execution reliability as onchain state grows, removing a key structural constraint on sustained network performance without directly increasing transaction throughput.
- Fermi Hard Fork (Testnet): The Fermi Hardfork entered testnet on November 10, 2025, consolidating a set of EVM and protocol changes aimed at improving execution efficiency and reducing the block interval from 750ms to 450ms. The testnet release advanced several performance-oriented BEPs and marked the next step in BNB Chain’s iterative upgrade cycle.
- BEP-592 (Block Access List): In December, BNB Chain introduced block access lists to reduce redundant state reads during block execution. By allowing validators to predefine accounts and storage slots expected to be accessed within a block, the mechanism improves cache efficiency and lowers disk I/O overhead. This reduces execution latency, particularly during contract-heavy workloads and periods of elevated DeFi activity.
- BEP-640: Launched on December 20, BEP-640 introduces an optional transaction gas limit cap on BNB Smart Chain to mitigate the impact of super-heavy transactions that can stall blocks and contribute to execution lag or reorg risk. The proposal recommends a voluntary per-transaction gas usage cap of 16,777,216 gas and is described as a client-level measure rather than a protocol-level hard fork.
- BEP-590: Announced on December 30, 2025, BEP-590 enhances BNB Smart Chain Fast Finality by expanding the vote inclusion window beyond the immediate parent block. By allowing proposers to aggregate validator votes from up to three recent ancestor blocks, the proposal improves finality reliability during network congestion and supports shorter block intervals.
- BEP-619: Announced on December 31, 2025, BEP-619 will reduce the block interval on BNB Smart Chain from 0.75 seconds to 0.45 seconds, representing a significant consensus-level upgrade. By increasing block production frequency, the proposal enables faster transaction confirmations, tighter consensus timing, and more responsive validator rotation, improving the overall user experience for dApps without changing EVM semantics or smart contract behavior.
Erigon Client Sunset
On November 25, BNB Chain announced that support for the Erigon client was scheduled to end. NodeReal, a core infrastructure contributor to the network, discontinued maintenance of the BNB Chain Erigon implementation on December 31, 2025, prompting a coordinated transition for node operators. All validators and node operators running Erigon were advised to migrate well ahead of the deadline to avoid disruptions.
To replace Erigon, BNB Chain added official support for Reth-BSC, a Rust-based execution client optimized for performance, resource efficiency, and modularity. Going forward, Reth and Geth will be the two recommended and fully supported execution clients. The shift reflects a broader effort to concentrate development resources on next-generation clients while maintaining execution client diversity.
Ecosystem Overview
RWAs
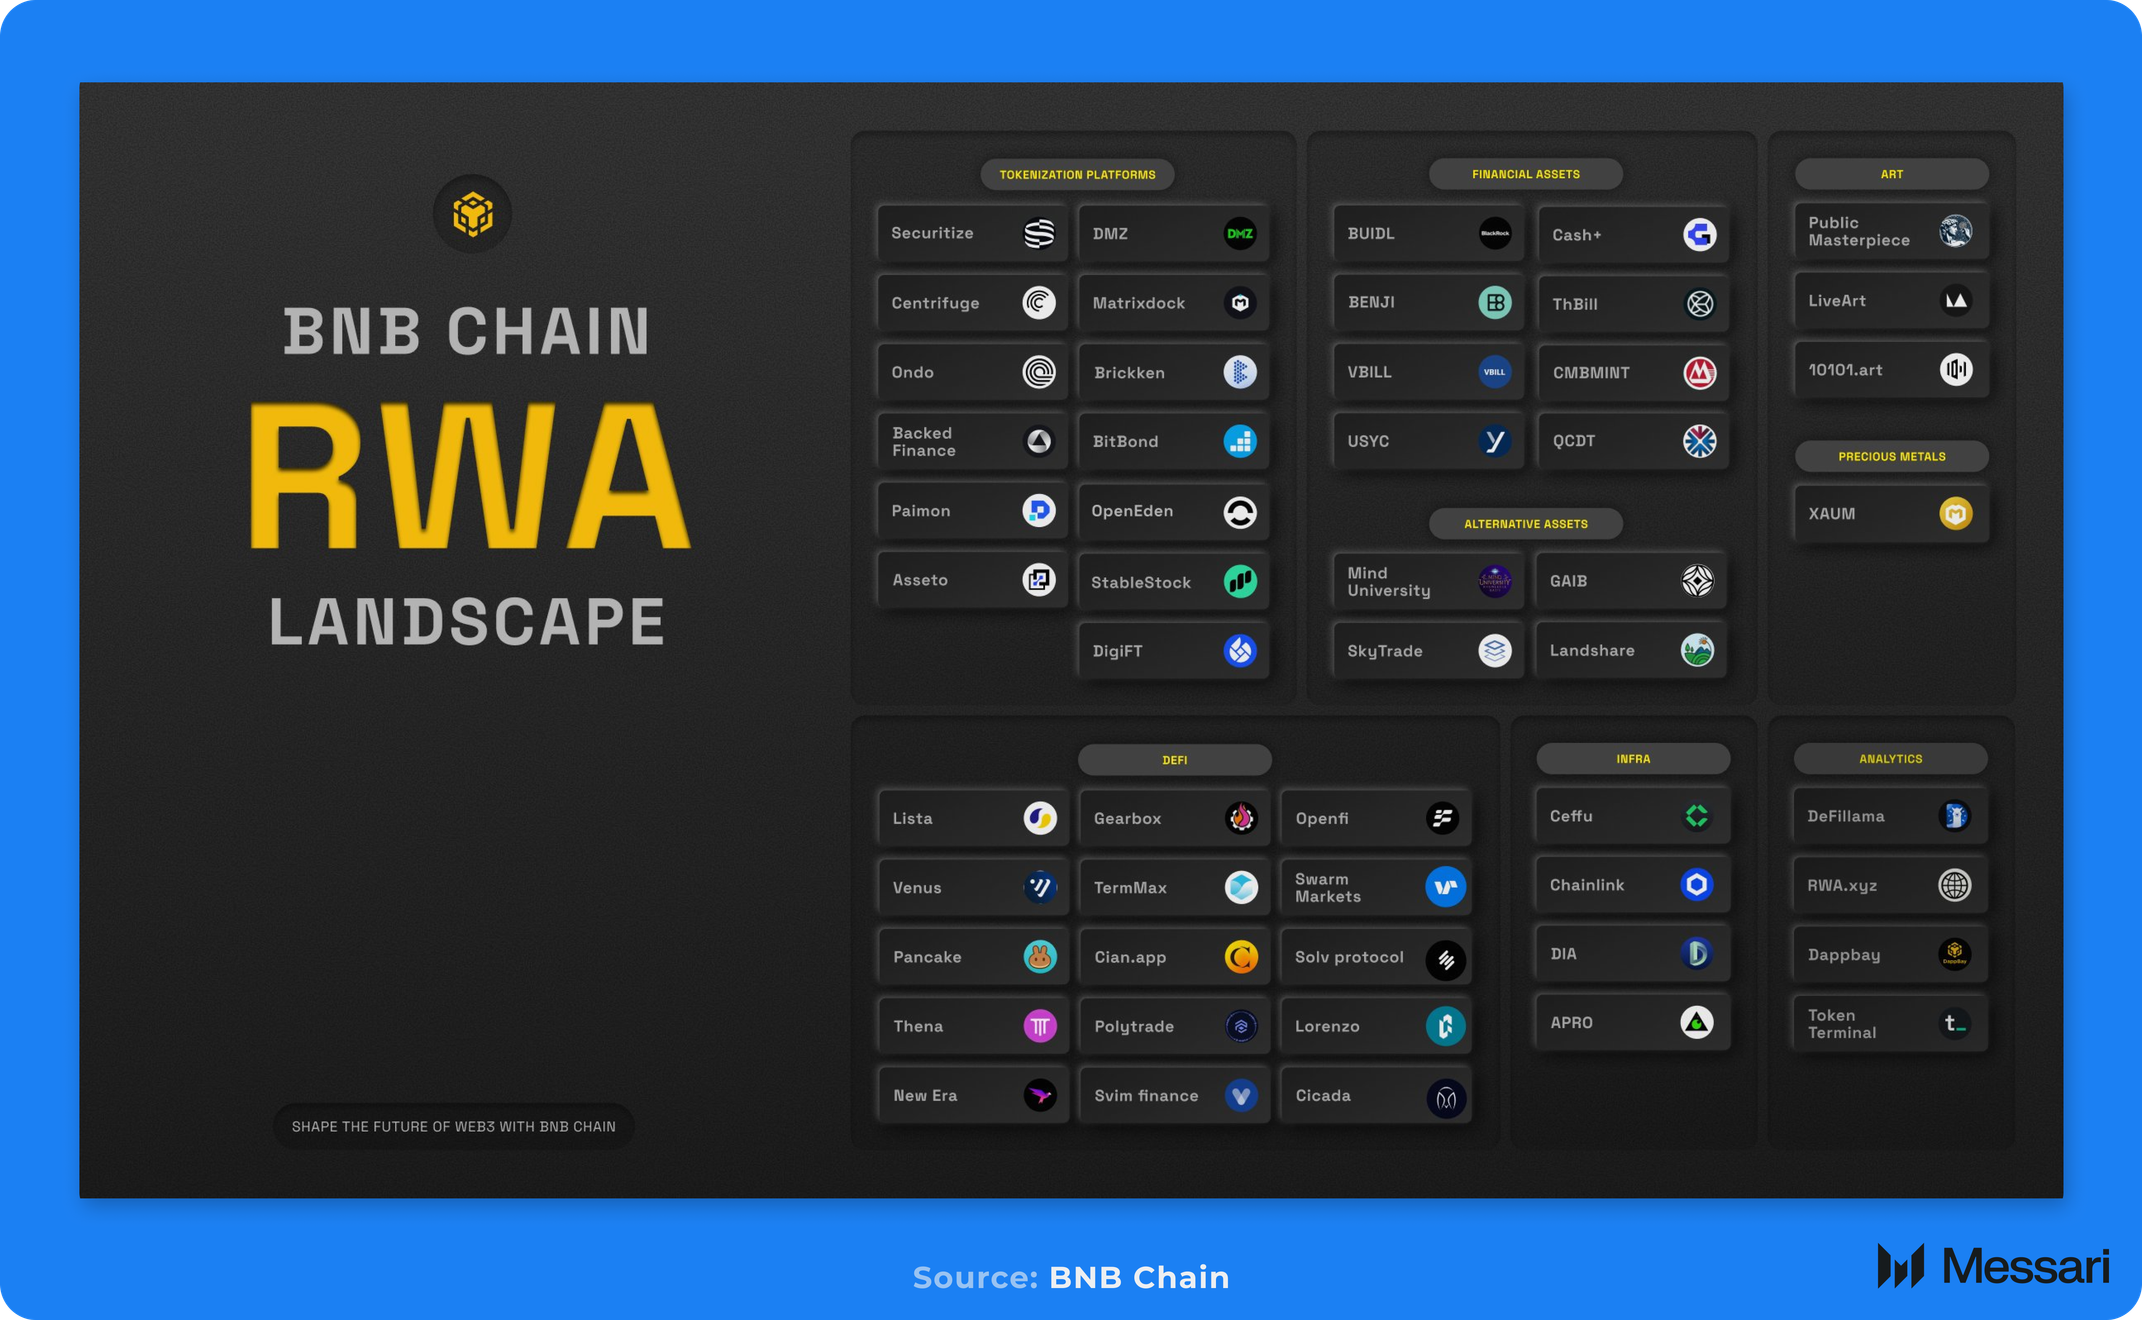
RWAs remained a core strategic focus for BNB Chain in Q4 2025, with continued progress across institutional adoption, product breadth, and integration with both DeFi and centralized infrastructure. Key developments in BNB Chain’s RWA landscape include:
- CMB International: On October 10, BNB Chain partnered with CMB International to launch their $3.8 billion tokenized money market fund on the chain. The product represents one of the largest single RWA deployments on any public blockchain and underscores growing comfort among traditional financial institutions with BNB Chain’s performance, cost profile, and operational reliability.
- Ondo Global Markets: On October 19, BNB Chain also expanded access to tokenized public markets through Ondo Global Markets, which brought more than 100 tokenized U.S. stocks and ETFs onchain. The integration broadened the RWA product mix beyond yield-bearing cash equivalents, enabling onchain exposure to equities and ETFs within DeFi-native environments.
- BlackRock: On November 14, BlackRock’s BUIDL fund, tokenized by Securitize, expanded onto BNB Chain and was accepted as collateral on Binance, further tightening the link between onchain RWAs, centralized liquidity venues, and institutional workflows.
Alongside this, BNB Chain emerged as a leading venue for USYC adoption, reinforcing the chain’s role as a settlement and distribution layer for tokenized cash-like instruments.
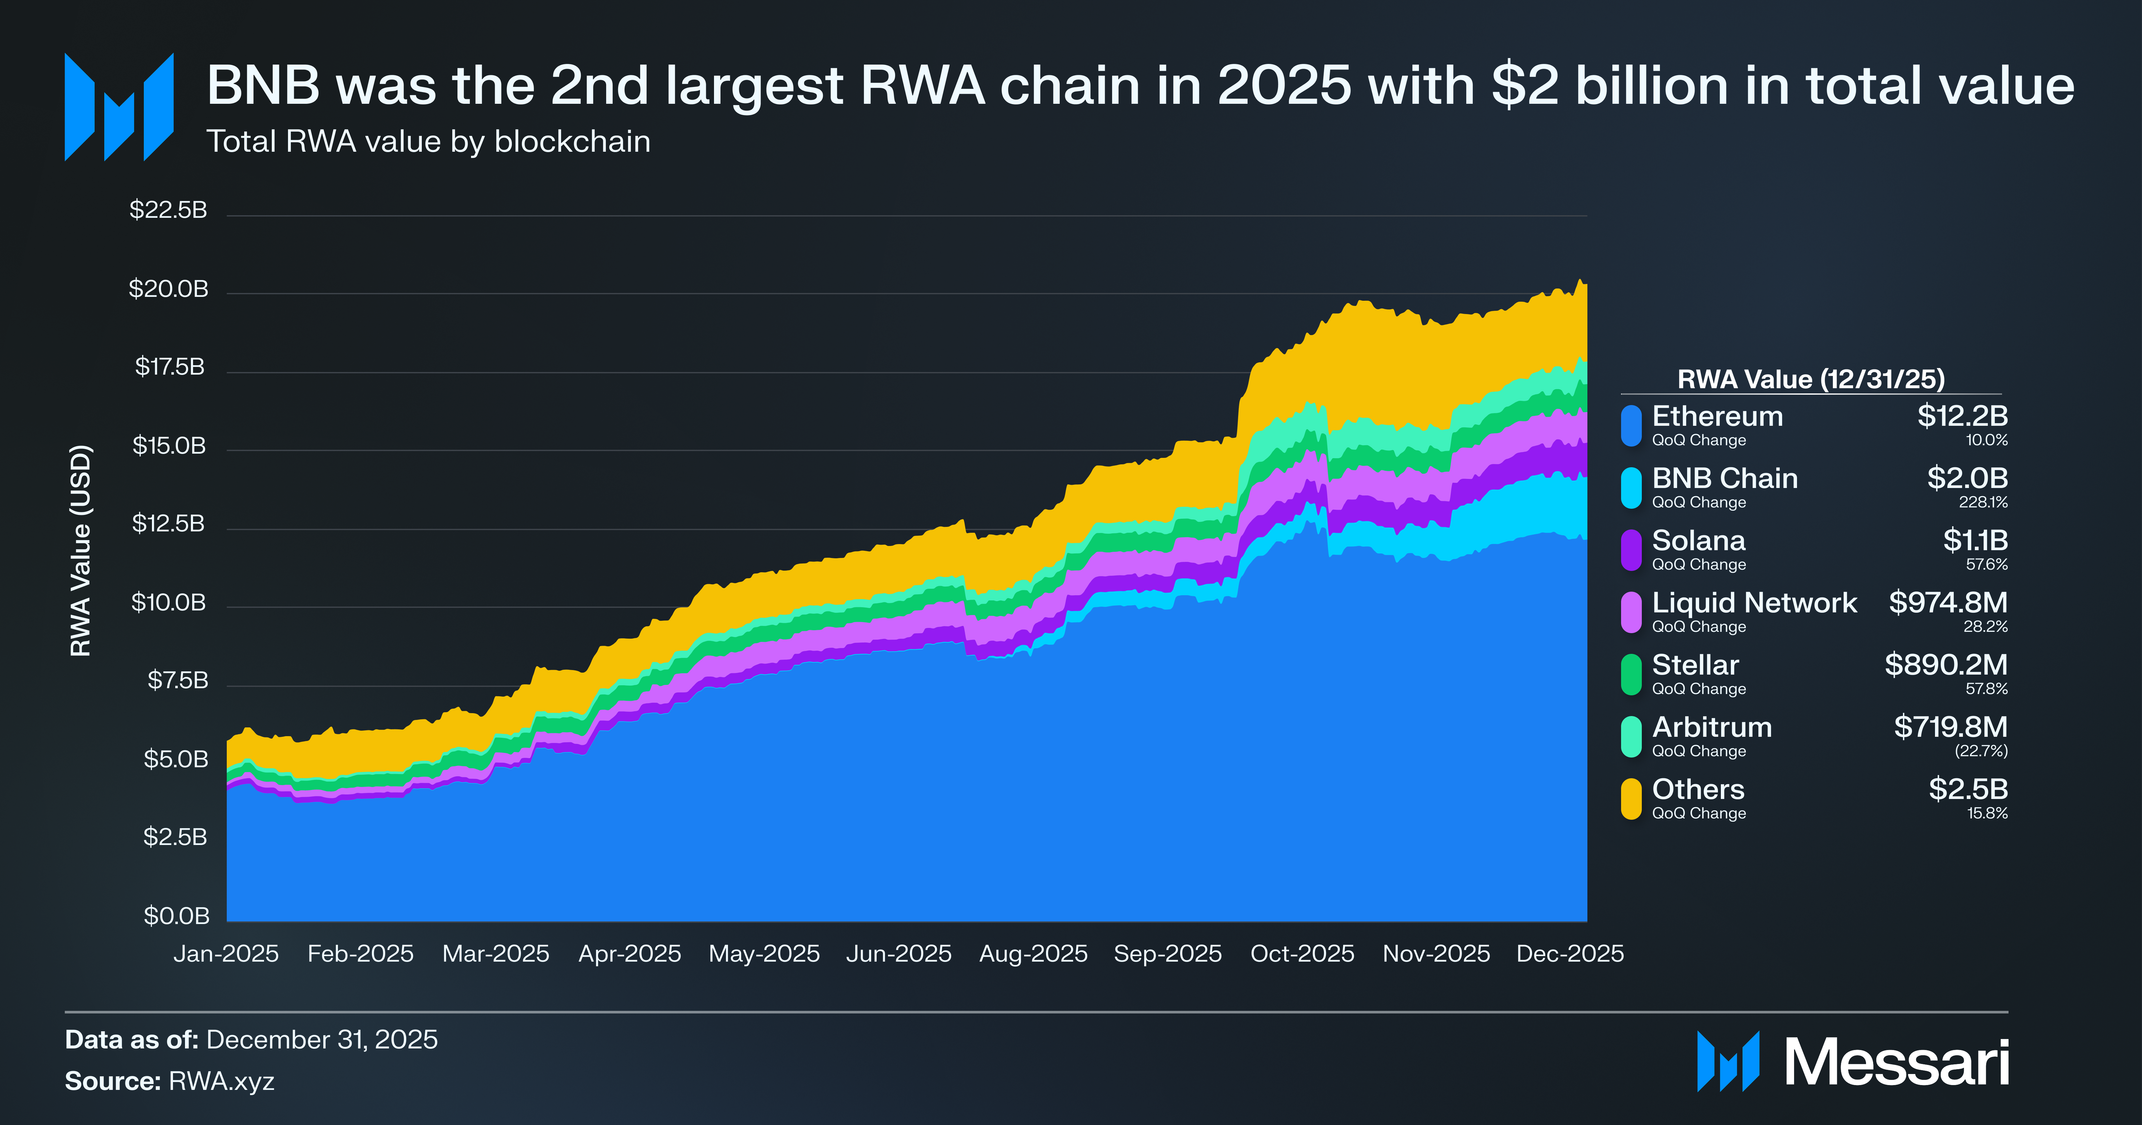
In Q4 2025, BNB Chain’s total RWA value reached $2 billion, up 228% from $608.4 million in Q3. This growth meant that by the end of Q4, BNB Chain ranked as the second-largest blockchain by total RWA value, surpassing Solana and trailing only Ethereum.
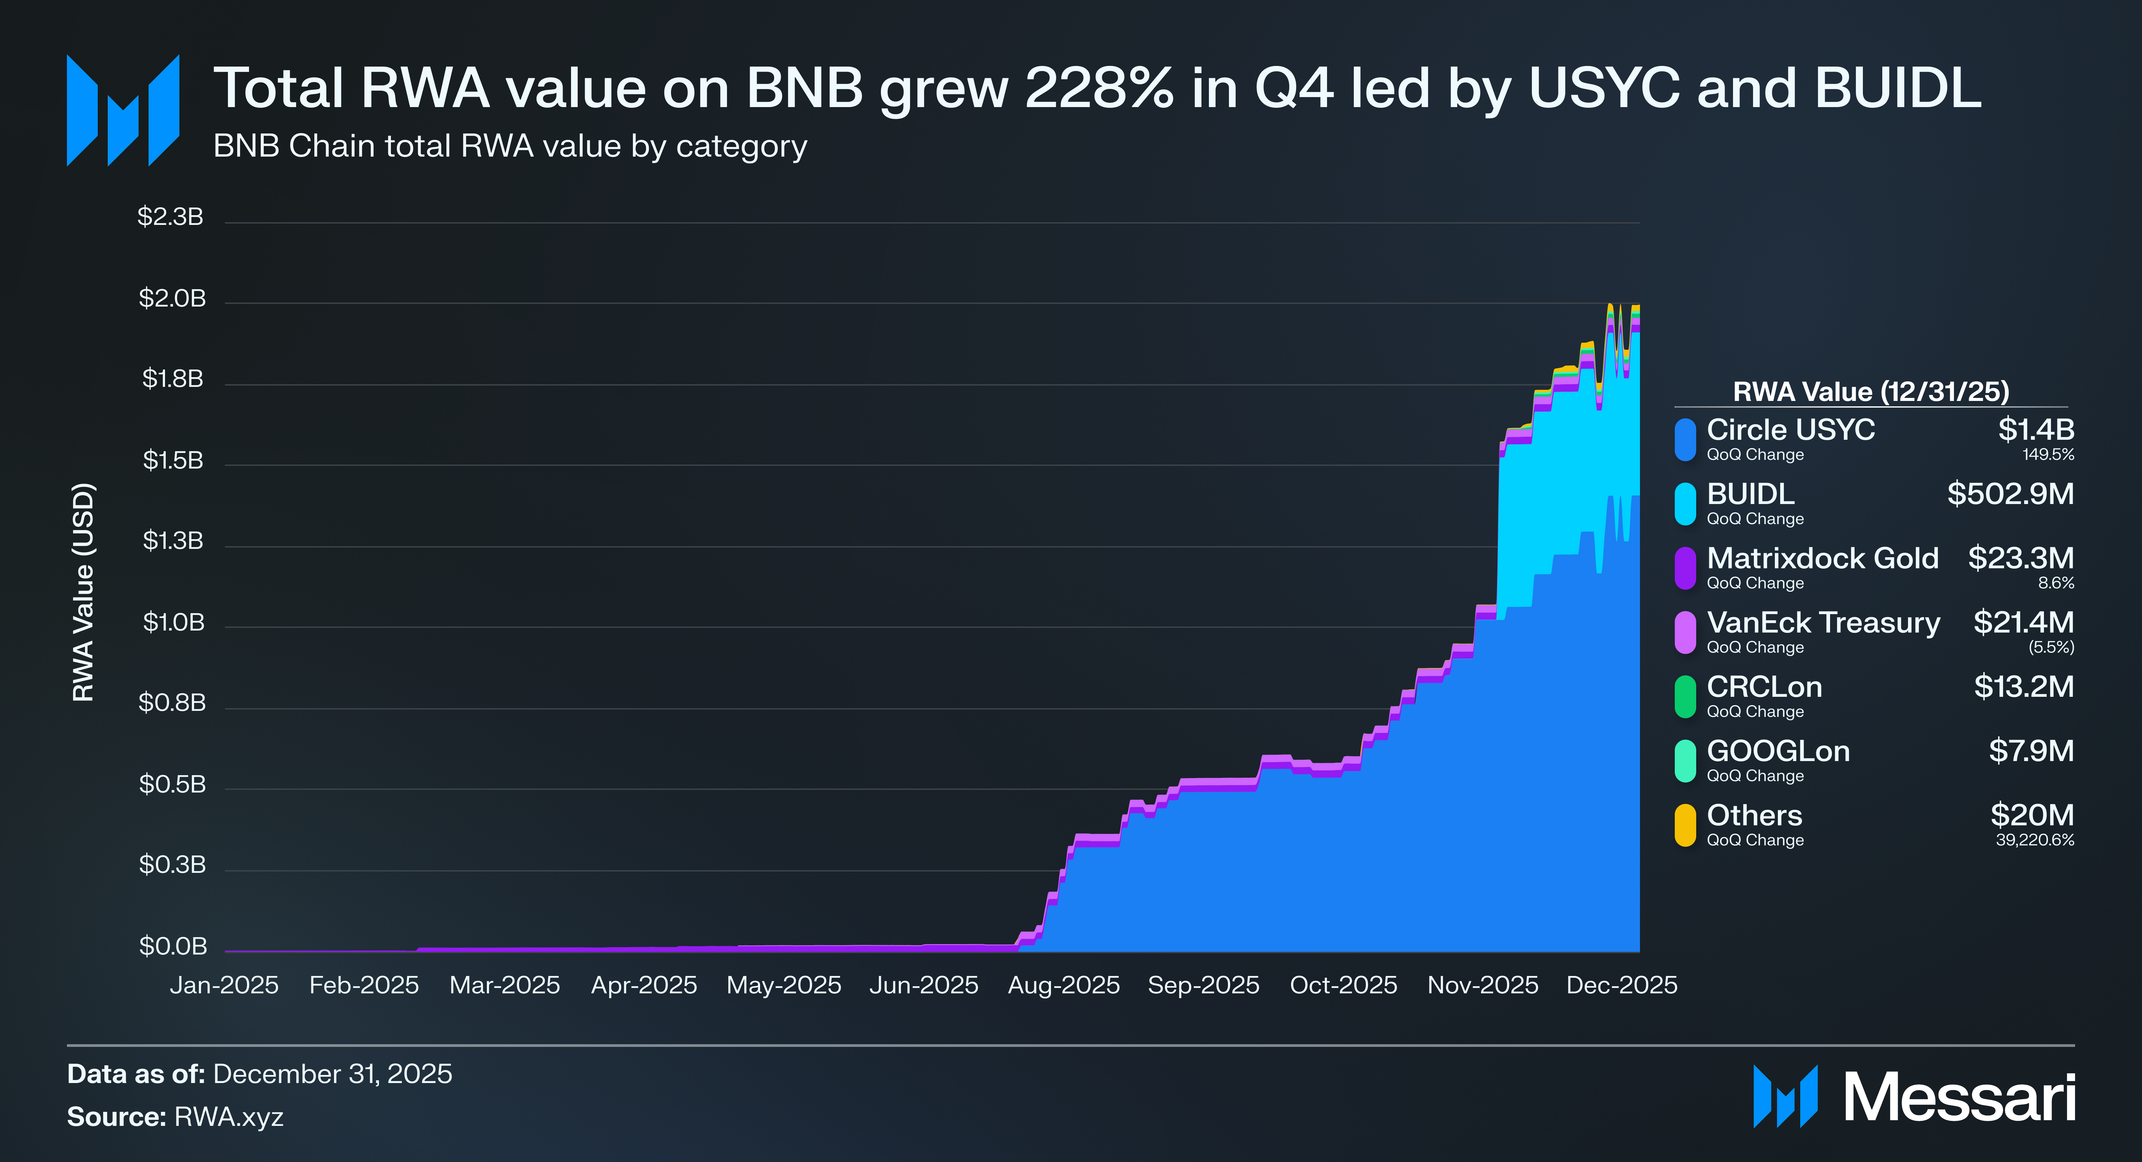
At the protocol and asset level, RWA value on BNB Chain was dominated by a small number of flagship products. USYC represented the largest share at $1.4 billion (70.5% market share), reflecting demand for yield-bearing, tokenized cash equivalents. BUIDL followed with $502.9 million in value (25.2% market share), supported by its integration with Binance.
Outside the top two, Matrixdock Gold (XAUm) took the third spot, with $23.3 million in value (1.2% market share), while VanEck’s Treasury Fund totaled $21.4 million (1.1% market share), and Ondo-issued Circle (CRCLon) and Alphabet Class A (GOOGLon) derivatives totaled $13.2 million (0.7% market share) and $7.9 million (0.4% market share) respectively.
Overall, Q4 reinforced RWAs as a long-term pillar of BNB Chain’s ecosystem strategy. Rather than competing solely on experimental asset issuance, the network continued to prioritize partnerships with established financial institutions, compliant product structures, and integration points that bridge DeFi, CeFi, and traditional capital markets.
DeFi
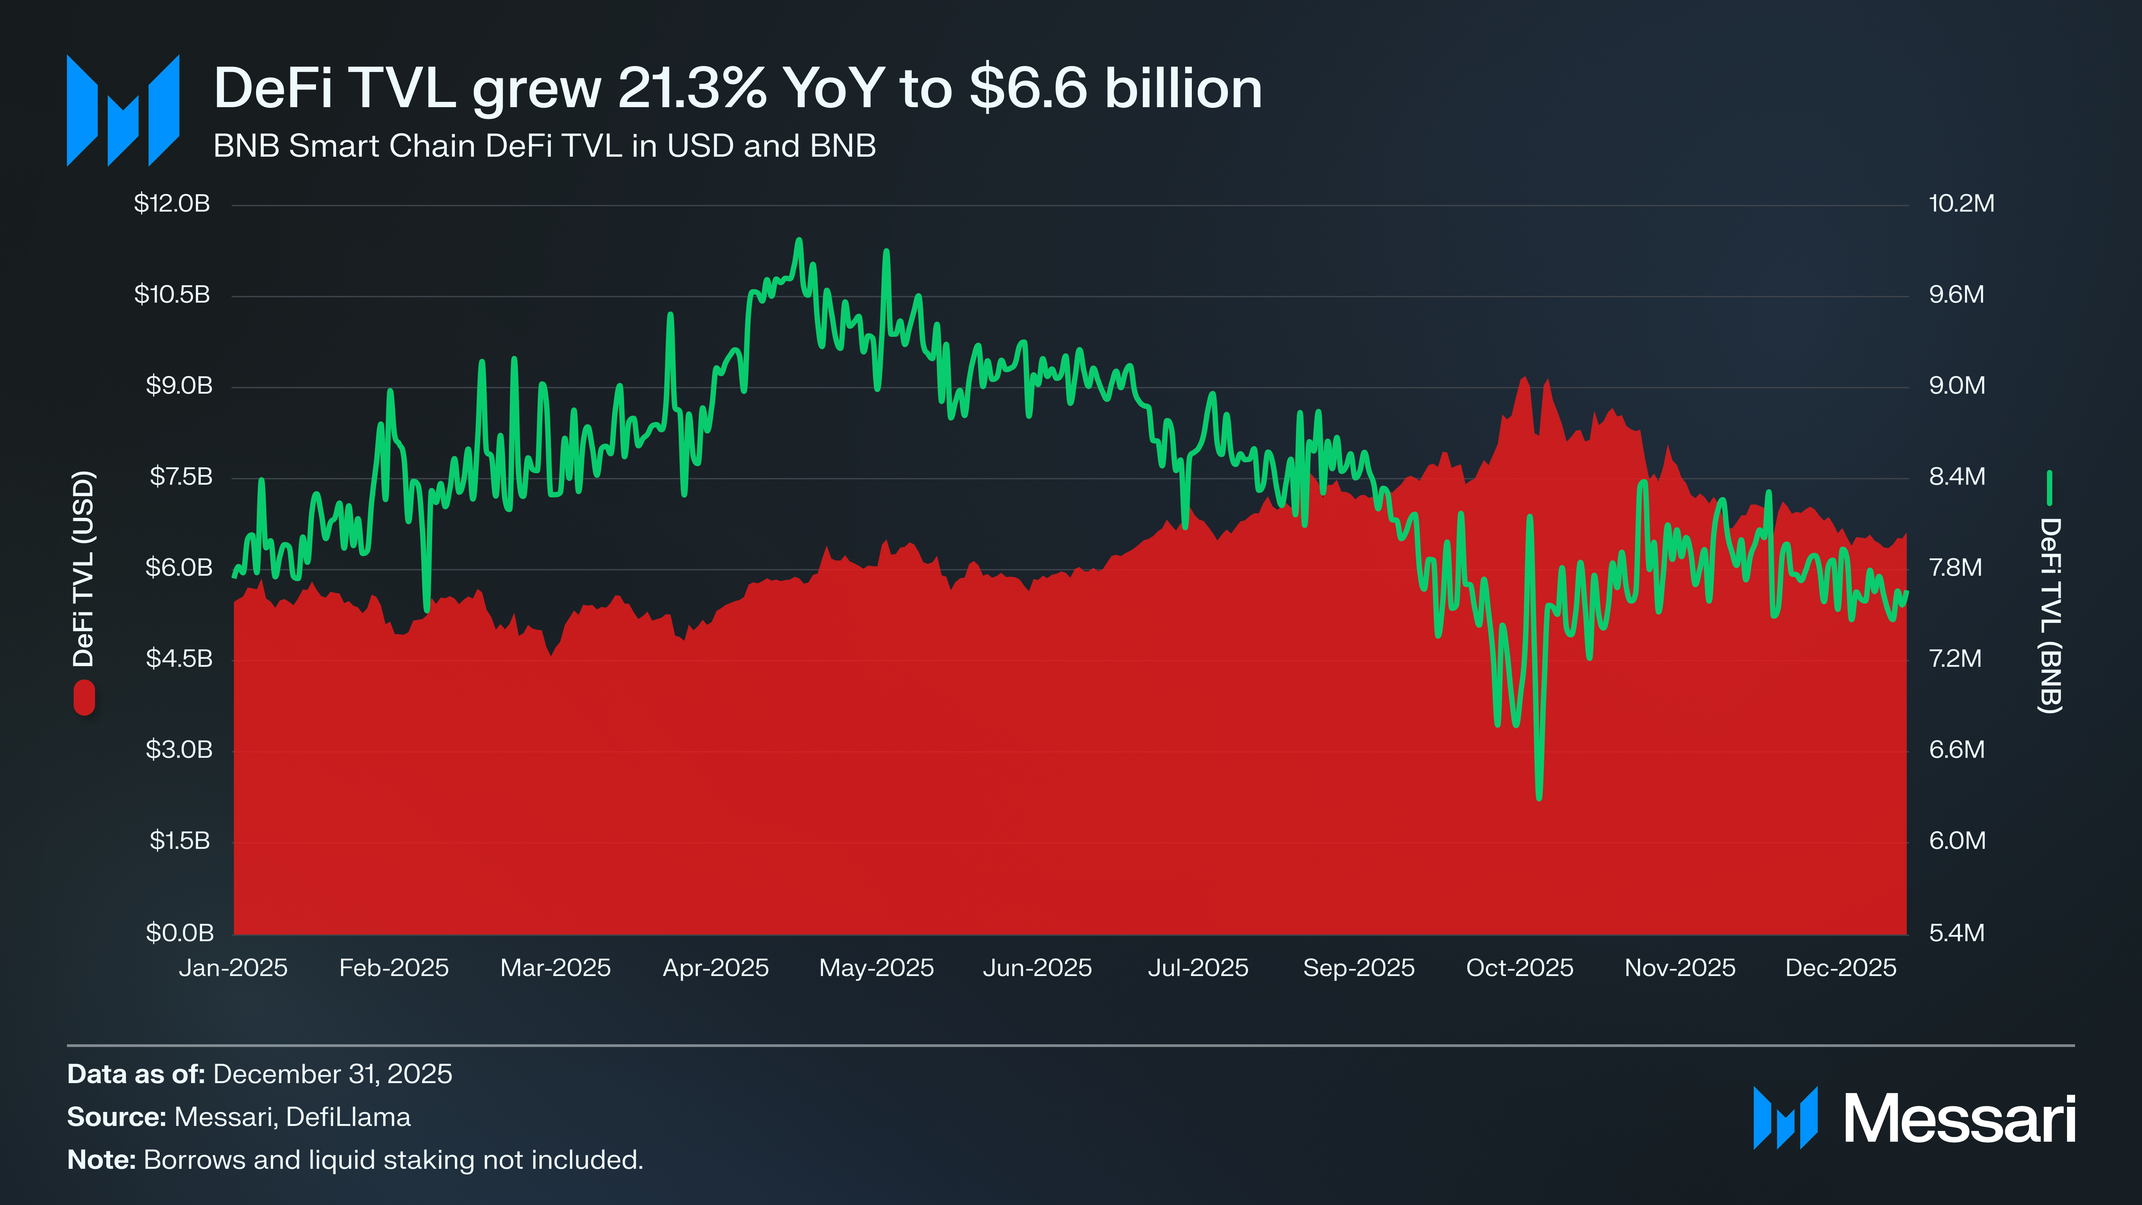
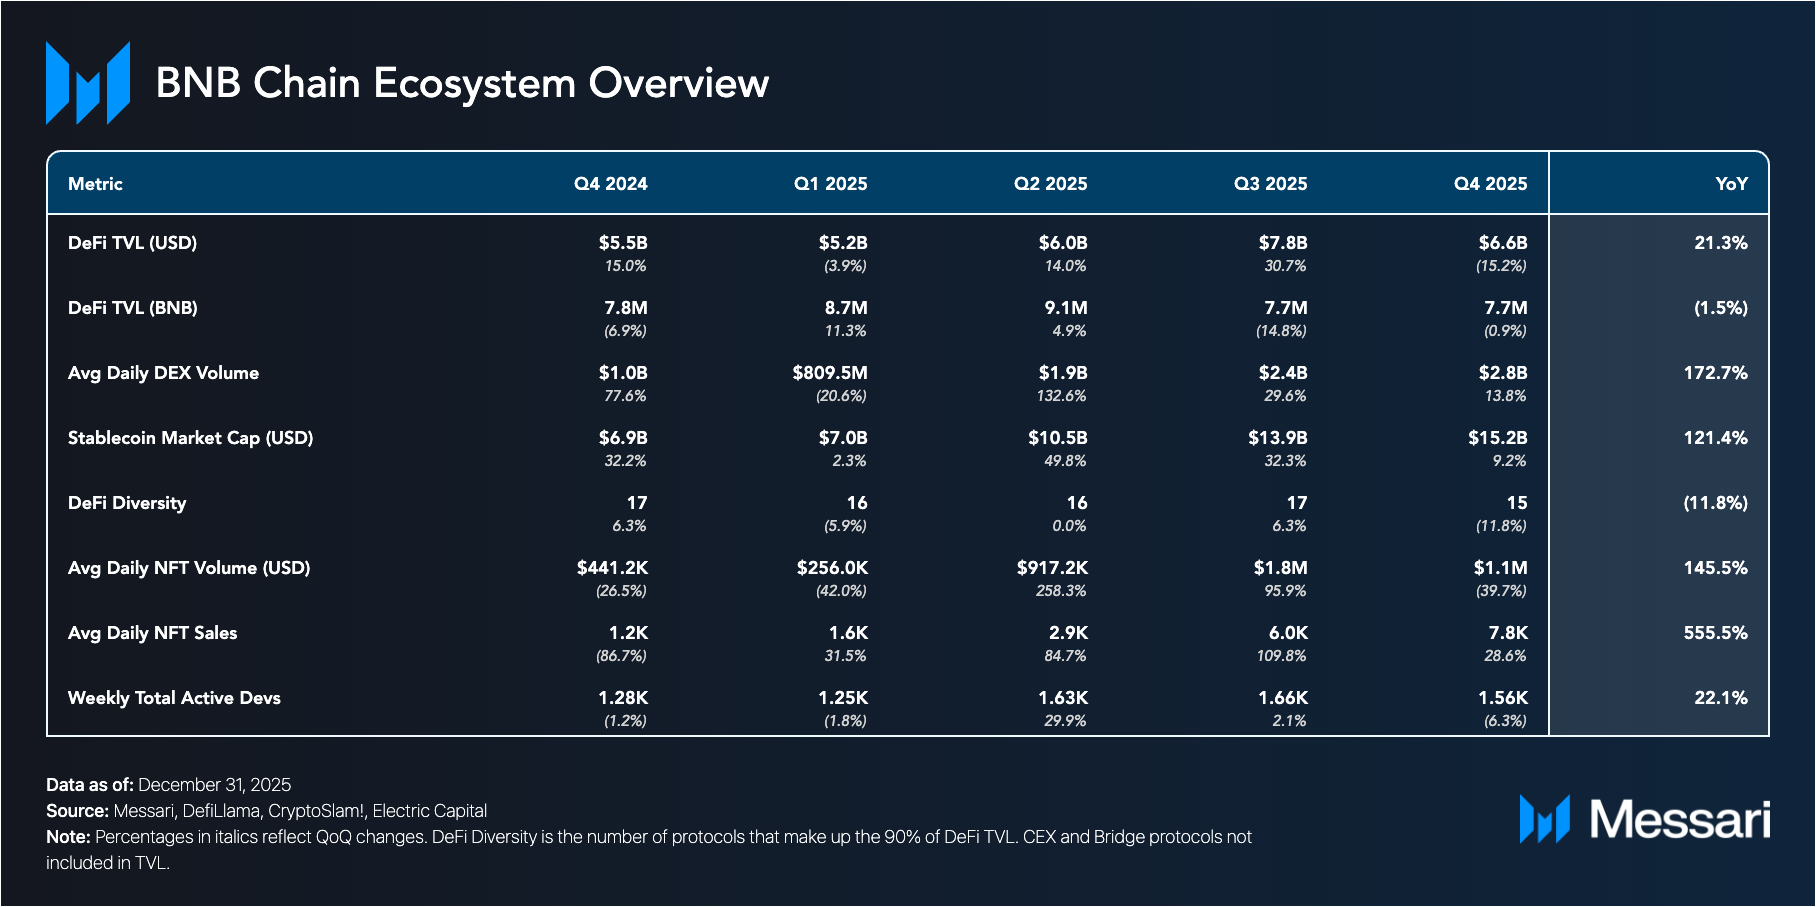
BNB Chain’s DeFi TVL declined in Q4 2025, falling 15.2% QoQ (up 21.3% YoY) to $6.6 billion, down from $7.8 billion in Q3. The contraction reflects broader industry headwinds following volatility across the crypto market. As of the end of Q4, BNB Chain remained the third-largest network by TVL, trailing only Ethereum and Solana.
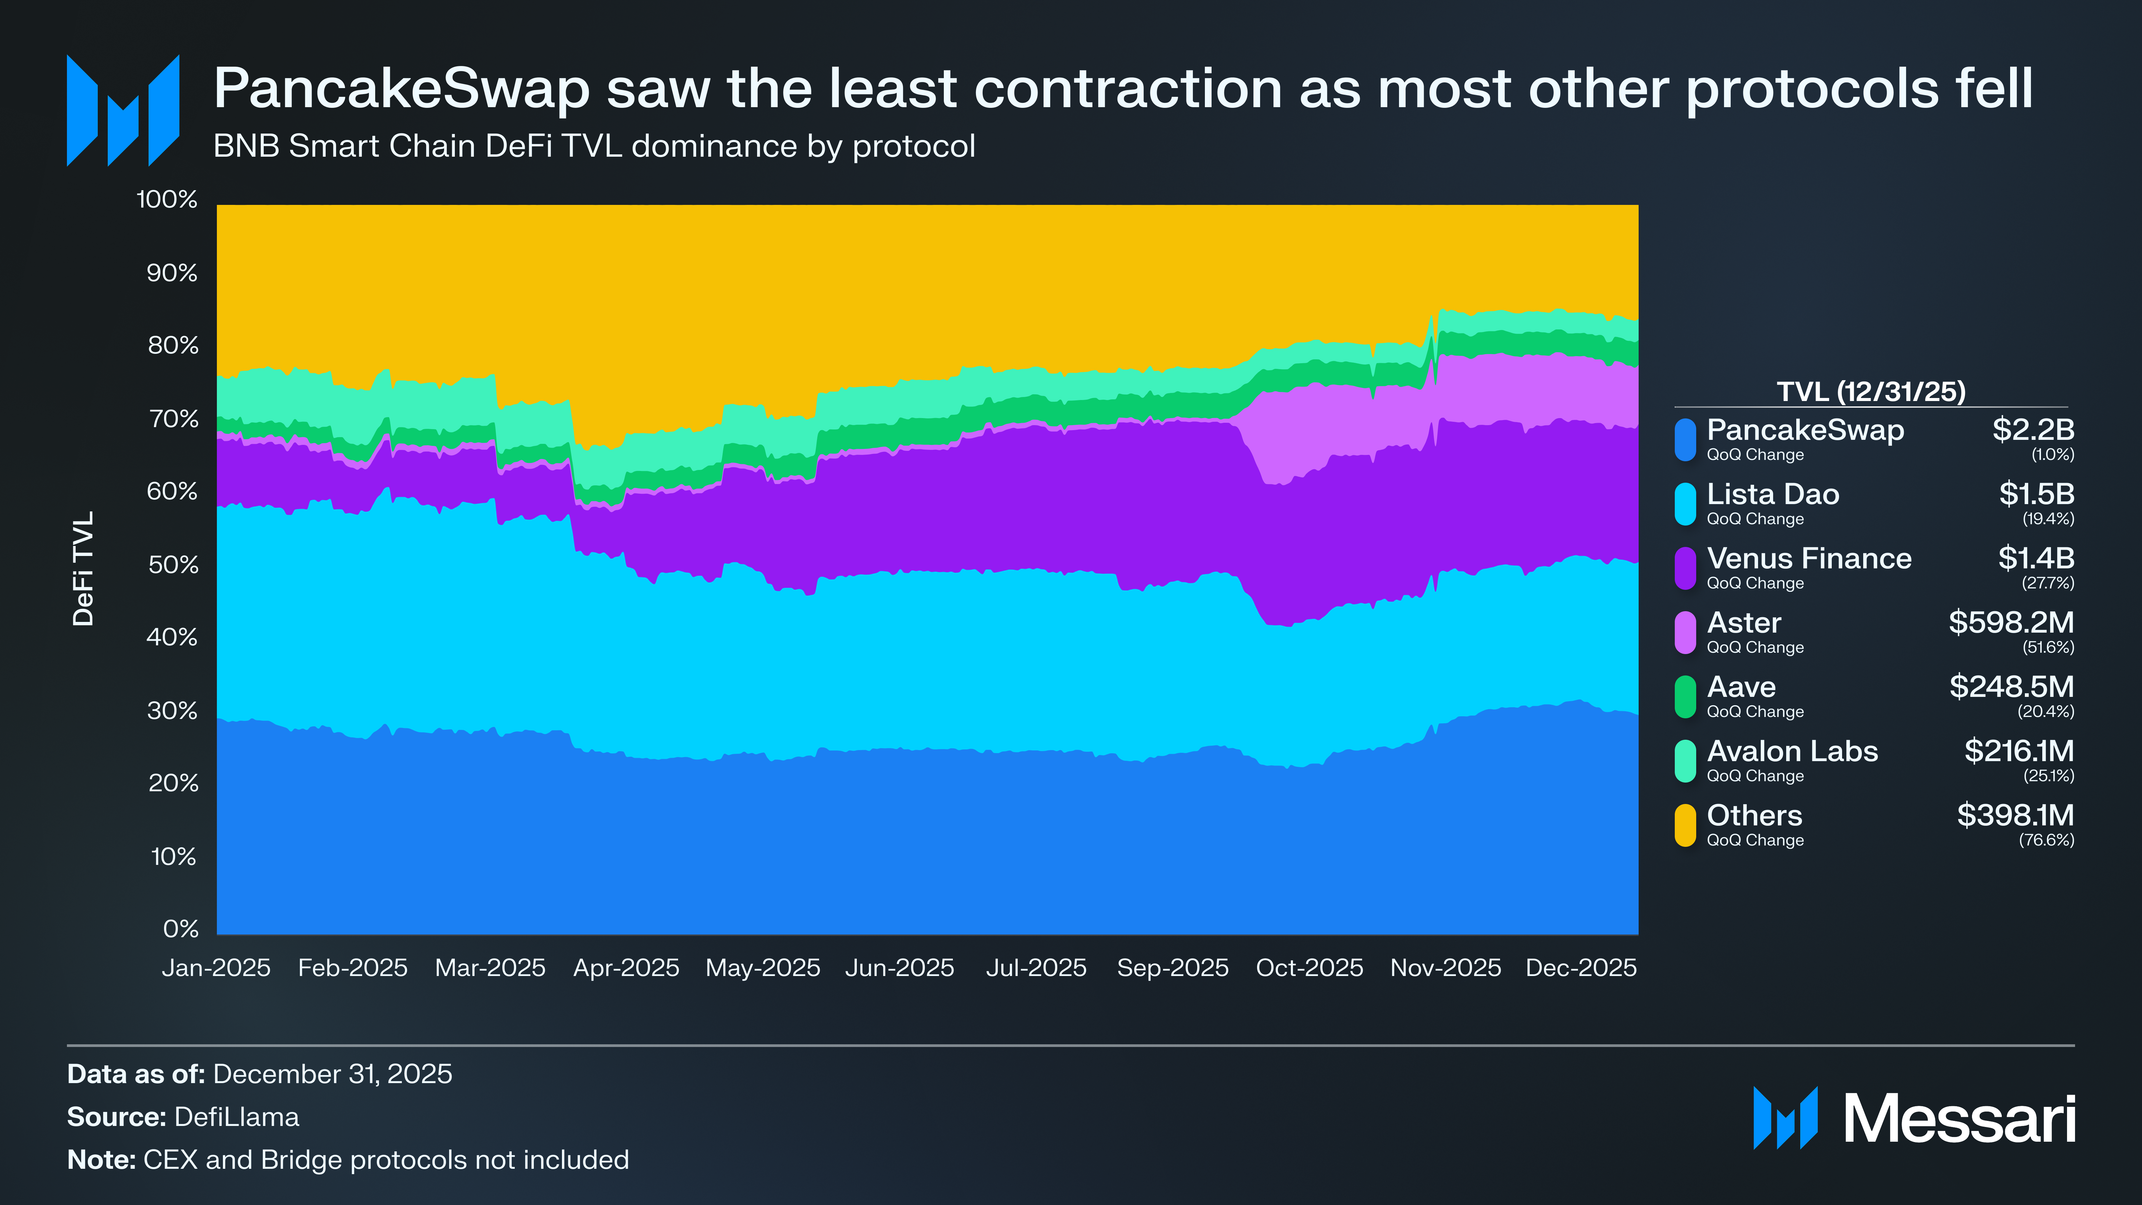
PancakeSwap remained the largest DeFi protocol on BNB Chain in Q4, ending the quarter with $2.2 billion in TVL and a 33.5% market share. The exchange’s TVL outperformed the market, falling just 1.0% QoQ. Despite the modest decline, PancakeSwap’s relative share increased from 28.7% in Q3, reflecting its ability to retain liquidity during a risk-off period. Continued high trading activity, the rollout of fee-earning limit orders, and a partnership with Ondo Finance supported protocol stickiness, even as DeFi capital pulled back.
Lista DAO closed the quarter as the second-largest protocol with $1.5 billion in TVL and a 23.4% market share, down 19.4% QoQ. The decline followed periods of forced liquidations across several vaults in October and November, which temporarily reduced confidence and liquidity. While Lista introduced new markets and capital efficiency improvements late in the quarter, including Smart Lending Pro mode and expanded RWA-related offerings, these initiatives were not sufficient to fully offset earlier outflows.
Venus Finance recorded one of the sharpest contractions among large protocols, with TVL falling 27.7% QoQ to $1.4 billion, representing a 21.1% market share. The decline coincided with reduced borrowing demand and deleveraging across money markets as volatility subsided following Q3 peaks. Despite the drawdown, Venus remained a core component of BNB Chain’s DeFi stack, retaining over one-fifth of total DeFi TVL.
Aster experienced the largest relative decline, with TVL dropping 51.6% QoQ to $598.2 million, reducing its market share to 9.0% from 15.8% in Q3. The contraction followed the unwinding of post-TGE liquidity and incentive-driven inflows that had driven rapid growth in the prior quarter.
Among smaller protocols, Aave held $248.5 million in TVL (3.8% market share), down 20.4% QoQ, while Avalon Labs declined 25.1% QoQ to $216.1 million (3.3% market share). The pullback across these protocols was consistent with broader deleveraging trends rather than protocol-specific events.
The Other category ended Q4 with $398.1 million in TVL (6.0% market share), reflecting net outflows from a long tail of smaller applications.
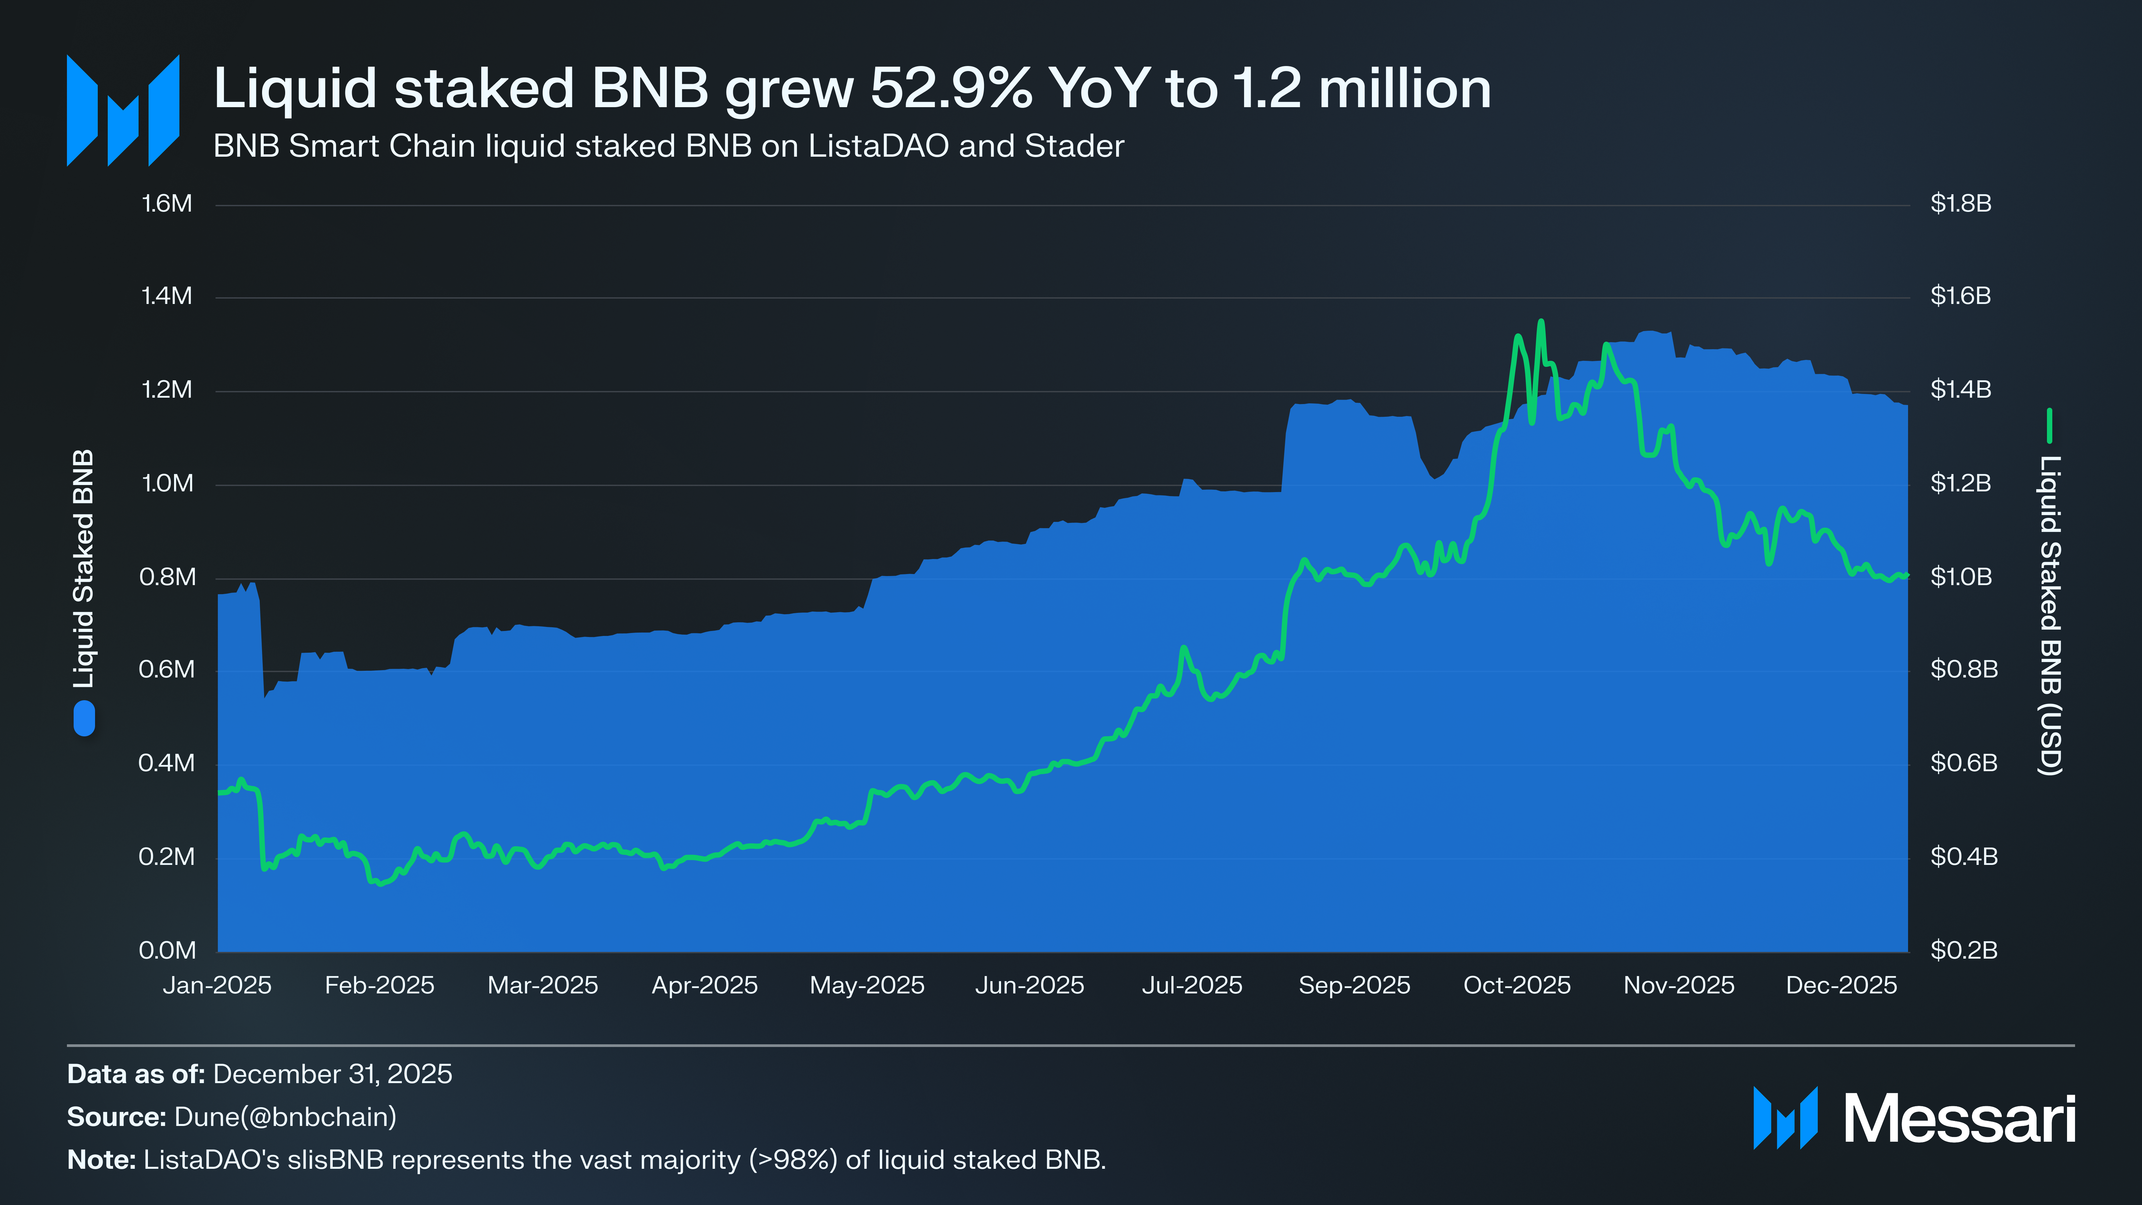
ListaDAO’s liquid staking solution, slisBNB, has emerged as the dominant liquid staking solution on BNB Chain. By the end of Q4, 1.2 million BNB ($1 billion) had been deposited into liquid staking solutions. This represents a 4.9% QoQ (52.9% YOY) increase in the liquid staked BNB, up from 1.1 million BNB at the end of Q3. In USD terms, however, liquid staked value dropped 10.6% QoQ (up 87.2% YoY), reflecting the drop in BNB’s token price.
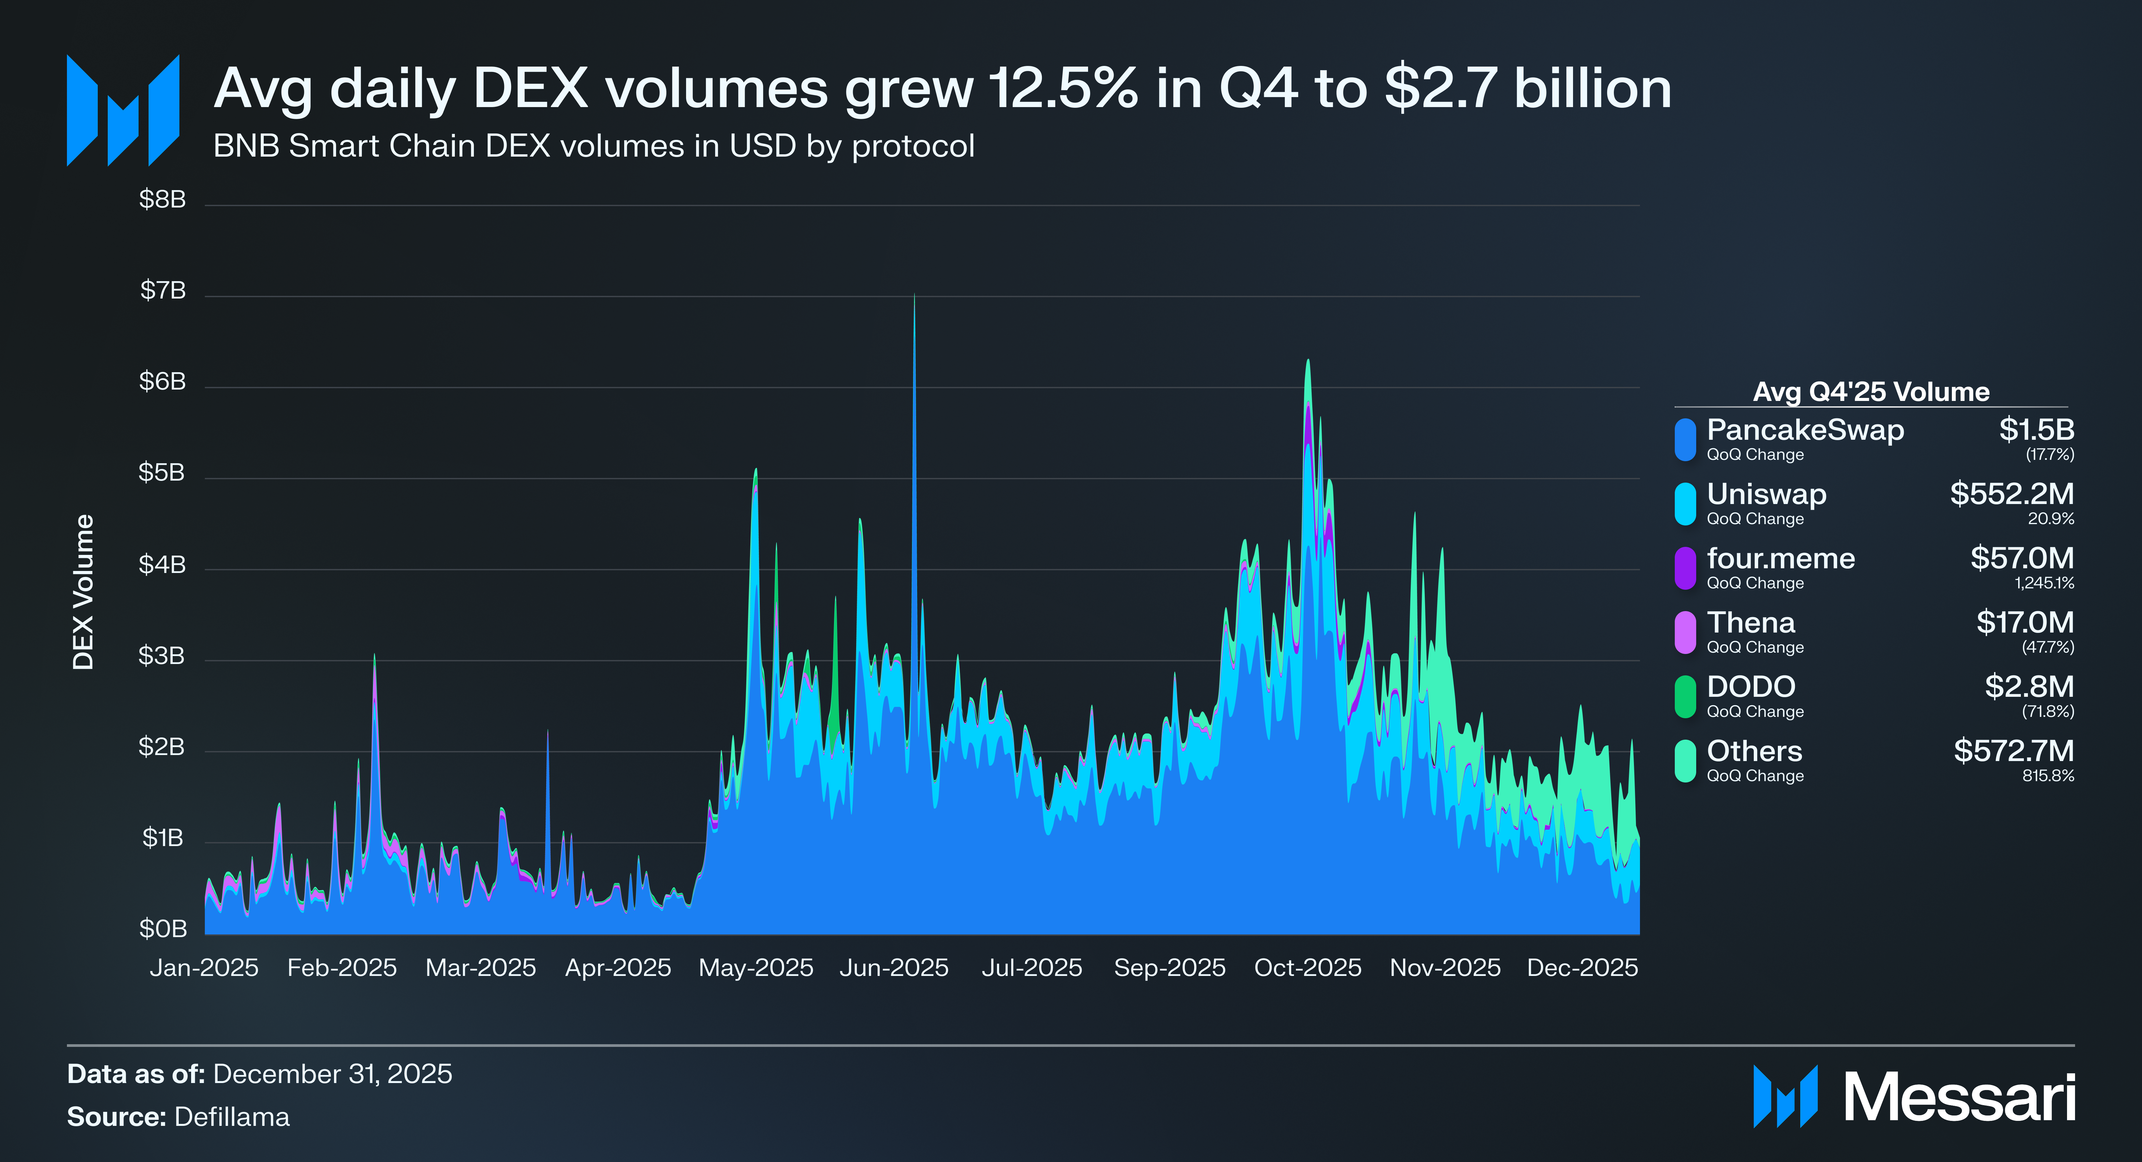
BNB Chain’s DEX activity increased in Q4 2025, with average daily volume rising 12.5% QoQ to $2.7 billion, up from $2.4 billion in Q3. This growth put BNB Chain in the number two spot among all other chains in terms of average daily DEX volume.
PancakeSwap remained the dominant DEX on BNB Chain, averaging $1.5 billion in daily volume, though volumes declined 17.7% QoQ. Its market share fell sharply from 76.8% to 56.2%, reflecting increased competition and a dispersion of trading activity across alternative venues. Despite the decline, PancakeSwap continued to anchor liquidity on the network, supported by sustained high user activity and ongoing product upgrades.
Uniswap strengthened its position as the second-largest DEX, with average daily volume increasing 20.9% QoQ to $552.2 million. Market share rose to 20.1%, up from 18.7% in Q3, indicating continued demand for Uniswap’s routing efficiency and cross-chain liquidity access on BNB Chain.
four.meme recorded the fastest growth among tracked venues, with average daily volume surging 1,245.1% QoQ to $57.0 million, lifting its market share to 2.1%. The increase reflects episodic, meme-driven trading activity during the quarter, though volumes remained small relative to leading DEXs.
THENA saw volumes decline 47.7% QoQ to $17.0 million, reducing its market share to 0.6%, while DODO’s volumes fell 71.8% QoQ to $2.8 million, reflecting reduced usage of its specialized liquidity models. The Other category grew, averaging $572.7 million in daily volume, up 815.8% QoQ, and accounting for 20.9% of total DEX volume. The increase suggests a fragmentation of trading activity across smaller and emerging venues, contributing meaningfully to overall DEX growth despite declines at several established platforms.
Stablecoins & BTC
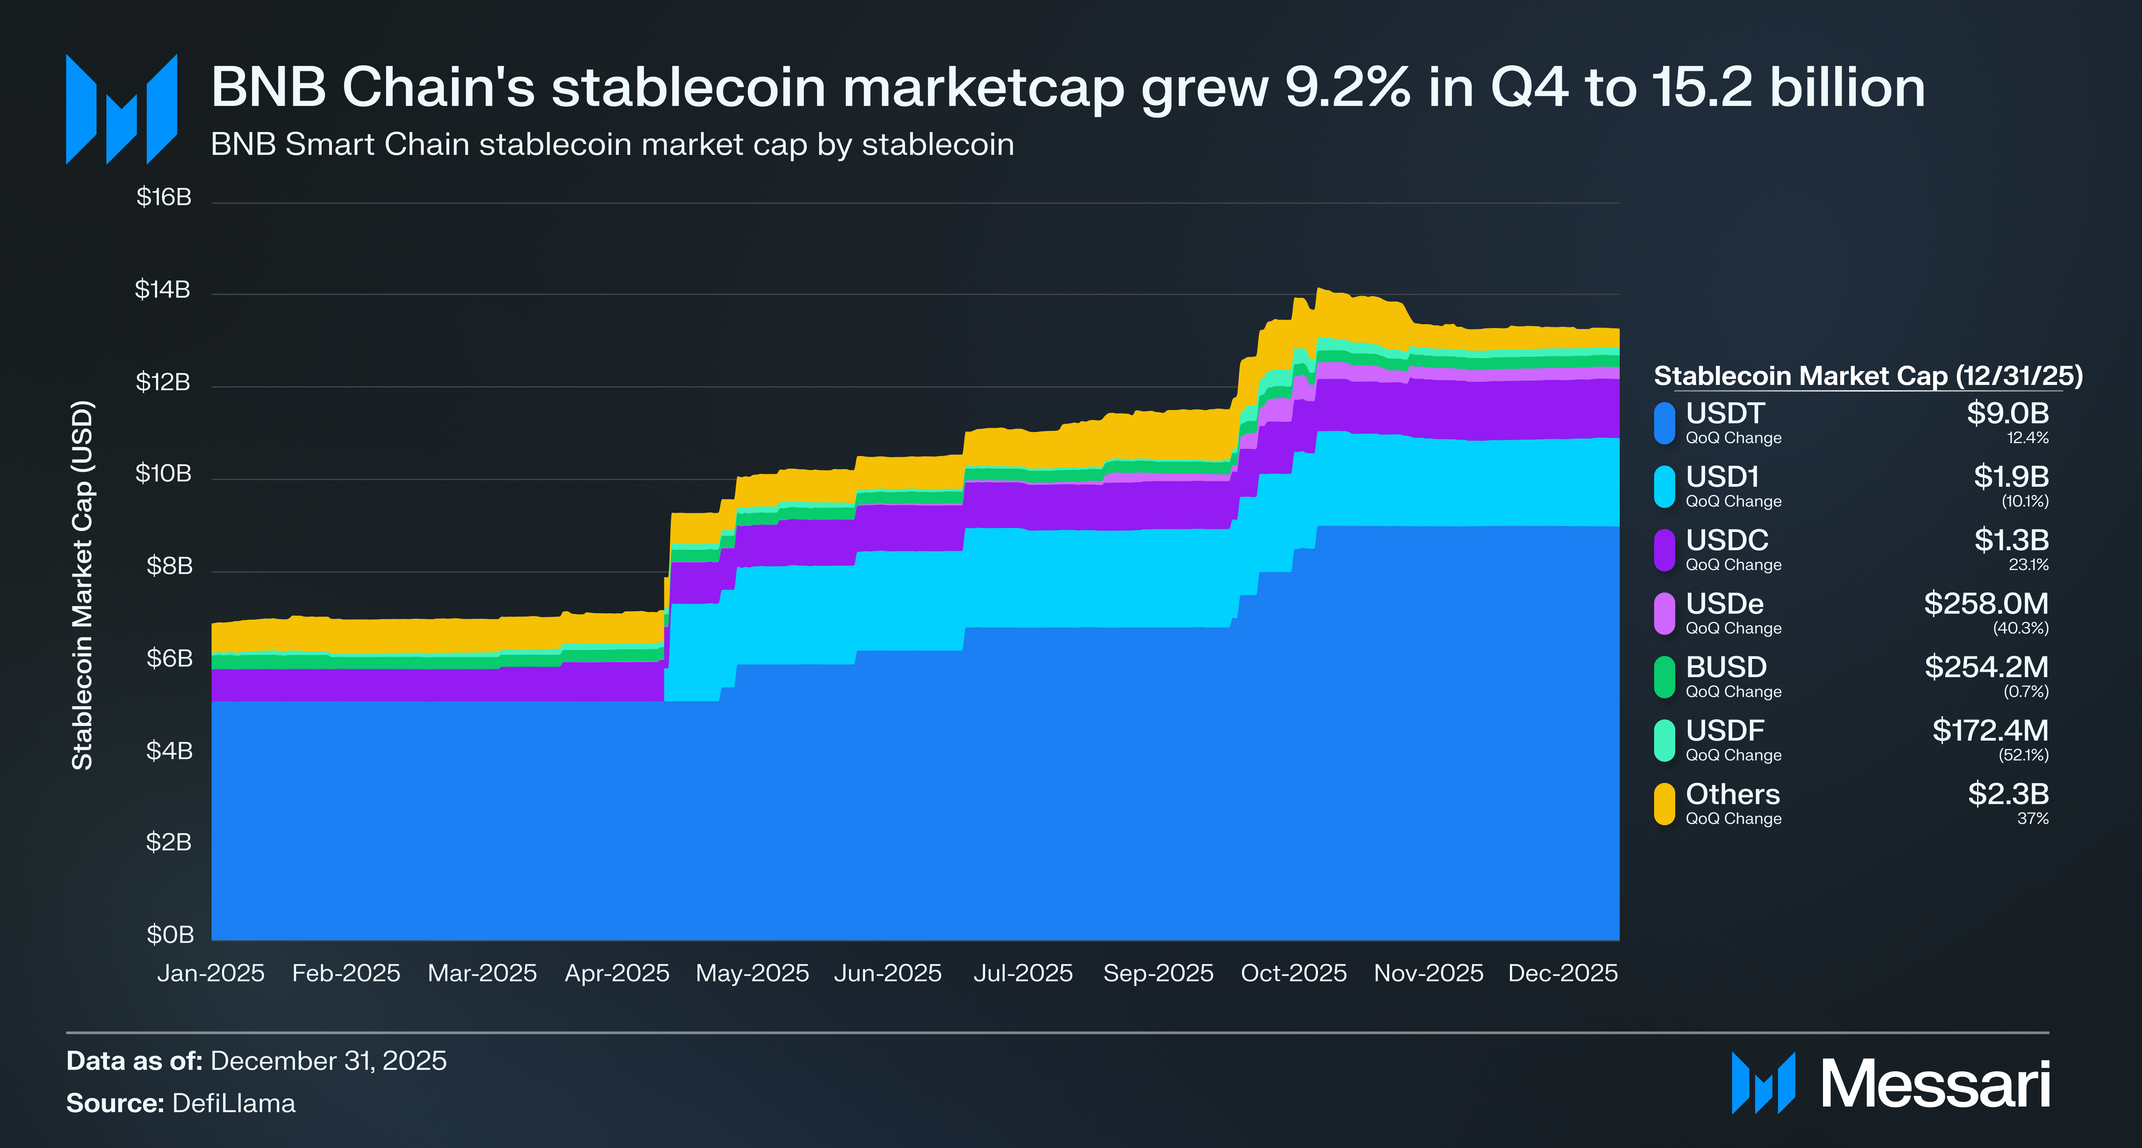
BNB Chain’s stablecoin market cap increased 9.2% QoQ to $15.2 billion in Q4 2025, up from $13.9 billion in Q3. Growth was uneven across issuers, reflecting a mix of continued adoption of fiat-backed stablecoins and a contraction among synthetic and yield-bearing assets following heightened market volatility in October.
USDT remained the dominant stablecoin on BNB Chain, ending the quarter with a $9.0 billion market cap and a 59.1% market share, up 12.4% QoQ. The increase reflected sustained usage of USDT as the primary settlement and liquidity asset across DeFi, centralized exchange flows, and payments.
USD1 remained the second-largest stablecoin with a $1.9 billion market cap (12.6% market share), but declined 10.1% QoQ. Despite the decline, USD1 continued to serve as a core stablecoin within BNB Chain-native DeFi applications.
USDC recorded one of the strongest expansions among major issuers, growing 23.1% QoQ to $1.3 billion and increasing its market share to 8.4%. Growth was supported by continued institutional usage, expanded payment integrations, and BNB Chain’s stablecoin-focused incentive programs, including the extension of the 0-Fee Carnival, which subsidized gas fees for USDC transfers and reduced friction for onchain activity.
USDe experienced a sharp contraction in Q4, with market cap falling 40.3% QoQ to $258.0 million (1.7% market share). The decline followed a major deleveraging event on October 10–11, when USDe briefly depegged during a broader market liquidation, triggering large-scale redemptions and a rapid reduction in circulating supply. While the protocol processed redemptions without downtime and later implemented supply-reduction measures, confidence around looped yield strategies weakened, contributing to lower issuance on BNB Chain through quarter-end.
The Others category grew 37.0% QoQ to $2.3 billion, increasing its market share to 15.4%.
Q4 also had a couple of key partnerships and product launches, which helped grow BNB Chain’s stablecoin ecosystem. These updates include:
- Better Payment Network (BPN) Partnership: On October 21, BNB Chain partnered with BPN to build a multi-stablecoin, onchain settlement network designed for real-time, cross-border payments without pre-funded accounts. The integration connects regional and global stablecoins and embeds BNB Chain liquidity into programmable payment and FX workflows. In December, the partnership expanded to enterprise use cases, enabling AWS customers to pay for services using BNB through BPN.
- Launch of $U by United Stables: On December 18, United Stables launched $U as a native stablecoin on BNB Chain, introducing a stablecoin-inclusive reserve model that allows USDT, USDC, and USD1 to be used as minting collateral. The design aims to reduce liquidity fragmentation by consolidating existing stablecoin balances into a unified layer. $U was added to BNB Chain’s 0-Fee Carnival and is designed to support future gasless and programmable payment features.
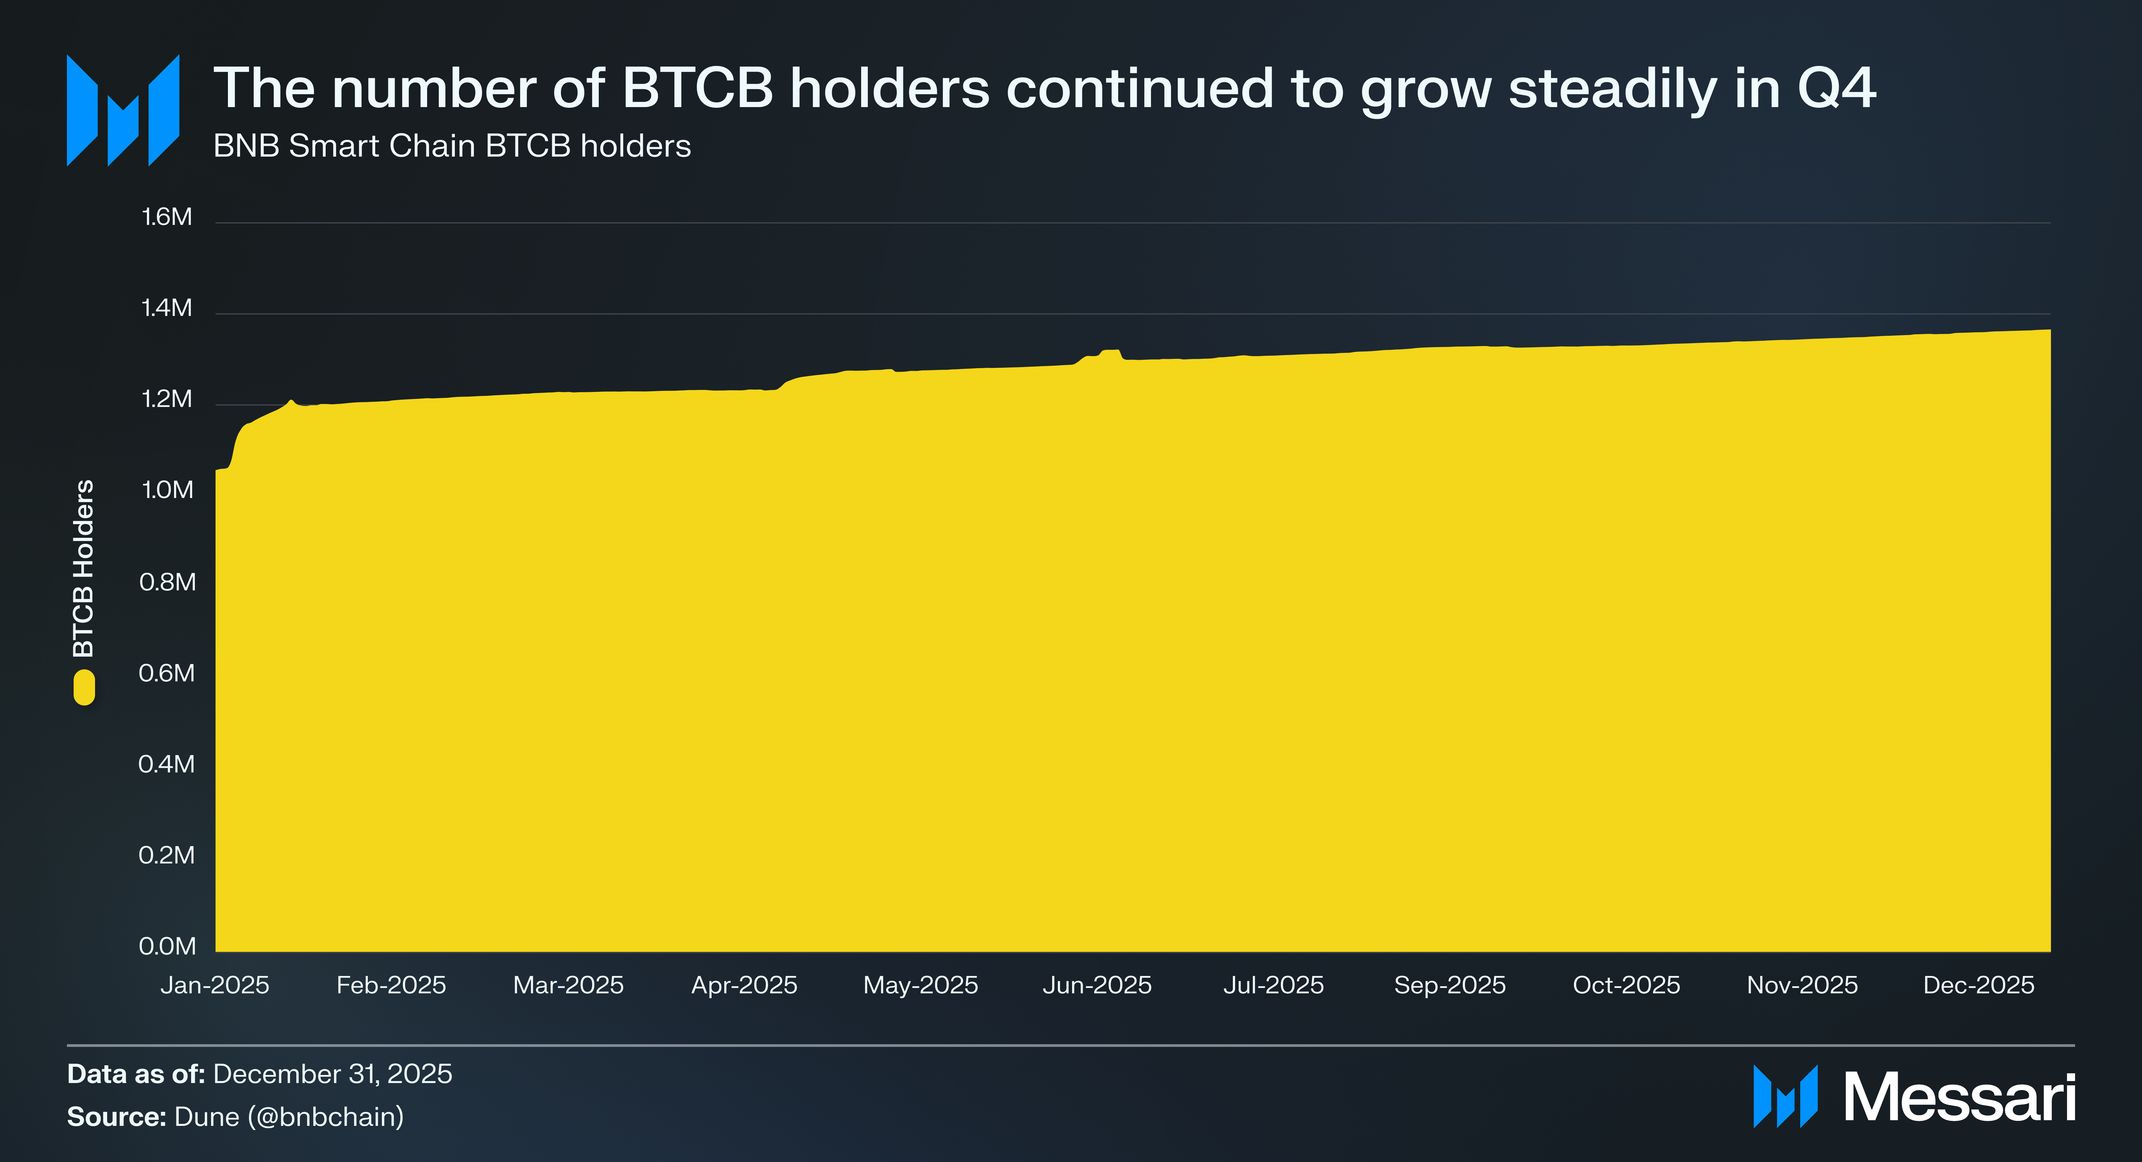
BTCB is one of the largest assets by market cap on the BNB Chain, outside of BNB and stablecoins. It is a tokenized version of Bitcoin on the BNB Chain. Since July 2024, the supply of BTCB has remained flat at 65,300. As for BTCB holders, they increased by 2.8% QoQ to 1.4 million. BNB Chain has been bolstered by its emergent BTCFi ecosystem. Projects like Solv Finance, Lorenzo, Lombard Finance, and more offer BTCB holders on BNB Chain the opportunity to participate in various DeFi opportunities.
Developer Ecosystem
- $1B Builder Fund Launch: On October 18, BNB Chain and YZi Labs announced a $1 billion Builder Fund to support long-term builders across DeFi, RWAs, AI, payments, trading, and wallets. The fund provides capital, incubation, integrations, and direct ecosystem access, reinforcing BNB Chain’s focus on sustaining builder activity beyond short-term incentives. The initiative builds on the MVB program, which has supported over 200 projects across ten cohorts.
- Multi-Sig Wallet (opBNB Safe) Sunset: On November 12, BNB Chain announced the sunset of legacy multi-sig Safe contracts on opBNB, requiring teams to migrate to supported singleton contracts. The transition ensures compatibility with maintained contract standards and reduces long-term security and maintenance risk. Developers and operators were guided through a structured migration process to preserve account integrity and signer configurations.
- BSCScan to BSCTrace Migration: On December 9, BNB Chain announced the deprecation of BSCScan’s free APIs, and encouraged developers to migrate to BSCTrace, an independent BNB Chain explorer powered by NodeReal. BSCTrace offers a free tier for BNB Chain, JSON-RPC 2.0 compatibility, and enhanced APIs optimized for BNB Chain workloads. The migration aims to provide better developer support to those building on BNB Chain, and lower the reliance on paid APIs.
2026 Technical Roadmap
On December 30, BNB Chain released its 2026 technical roadmap, which defines the progress made in 2025 and outlines its goals for 2026. In 2025, the network prioritized reliability, execution speed, cost efficiency, and fairness, maintaining zero downtime while processing up to 5 trillion gas per day. These priorities translated into higher throughput, lower latency, and reduced gas costs, establishing a baseline for continued scaling as usage expands across trading, stablecoins, RWAs, and institutional activity.
2025 Recap
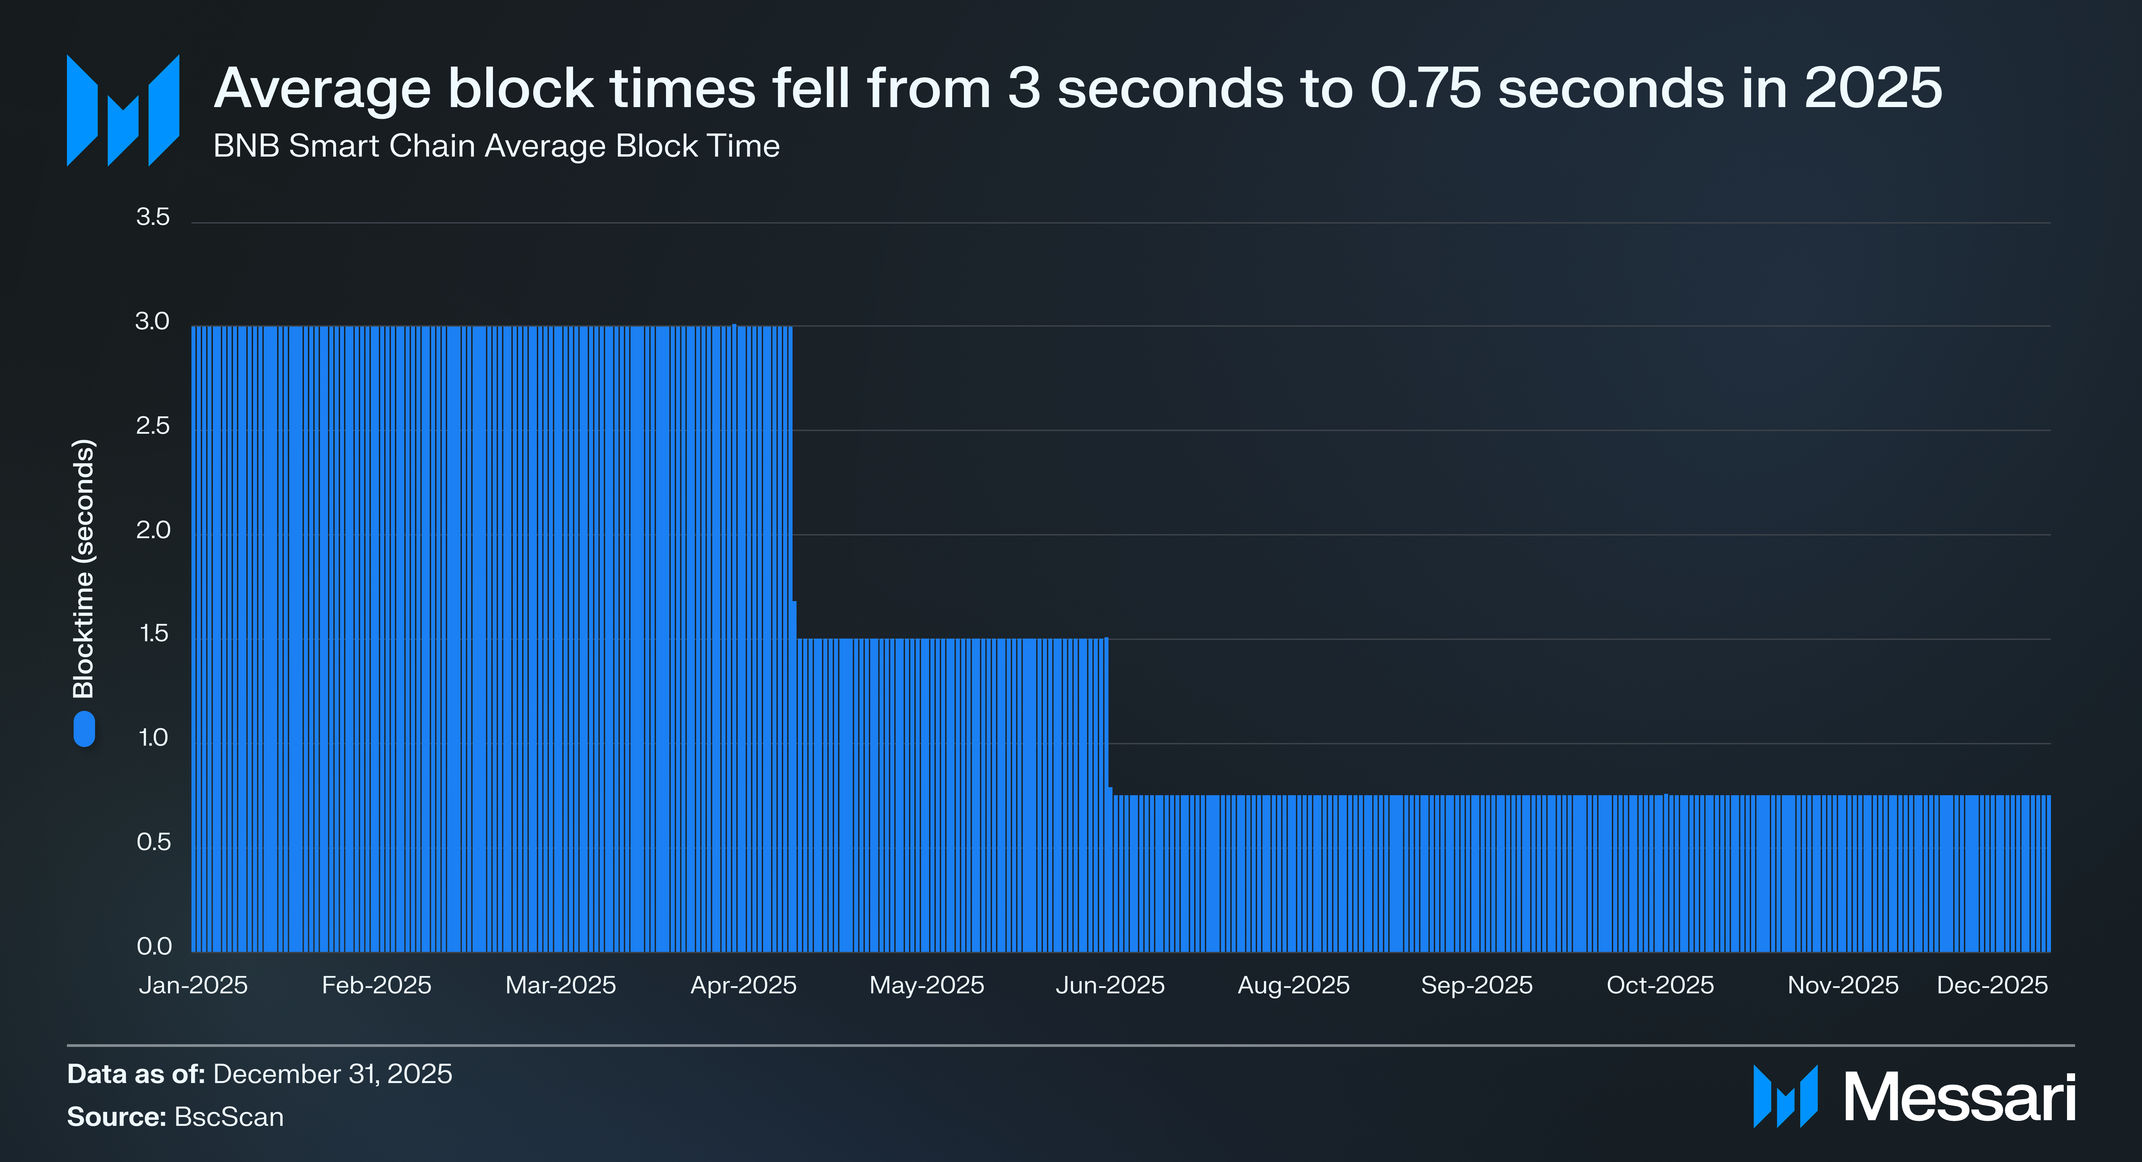
BNB Chain executed a series of four hardforks in 2025: Pascal, Lorentz, Maxwell, and Fermi (ongoing). Combined, these upgrades improved BNB Chain’s performance in the following ways:
- Reduced block times from 3 seconds to 0.45 seconds.
- Dropped transaction finality from 7.5 seconds to 1.1 seconds.
- Increased network bandwidth over 2x to 133 million gas per second.
- Reduced gas prices from 1 gwei to 0.05 gwei.
2026 Goals
BNB Chain’s primary technical objectives for 2026 include:
- Sustain high-throughput execution: Build on 2025 protocol upgrades that reduced block times to sub-second levels and enabled the network to consistently process up to 5 trillion gas per day. The 2026 target is sustained throughput of approximately 20,000 transactions per second with sub-second finality.
- Deliver near-instant transaction confirmation: Reduce end-to-end confirmation latency, with a best-case target of 150 milliseconds, enabling real-time trading and user experiences comparable to centralized systems.
- Adopt a hybrid off-chain and onchain compute model: Introduce a hybrid execution architecture that combines off-chain computation with onchain verification through execution proofs and attestations. This approach aims to scale performance without compromising determinism or security.
- Strengthen decentralization and fault tolerance: Improve validator models and fault tolerance mechanisms to ensure the system remains resilient under extreme load, while avoiding centralization pressures introduced by higher hardware or performance requirements.
- Maintain production-grade security and reliability: Preserve best-in-class security guarantees and operational stability, treating reliability under peak conditions as a baseline requirement rather than a differentiating feature.
Over a longer horizon, BNB Chain is designing a next-generation trading chain intended to support extreme performance requirements, including near-instant confirmation and significantly higher execution capacity. The roadmap emphasizes continuity, with opt-in migration paths and compatibility layers to ensure existing applications and assets can transition on their own timelines. Overall, the 2026 roadmap continues incremental, production-driven optimization, with an emphasis on sustaining performance, reliability, and fairness as network usage grows.
Closing Summary
BNB Chain ended Q4 2025 with continued progress across infrastructure, institutional adoption, and network usage, even as market conditions weakened late in the quarter. RWAs emerged as a clear growth driver, with total onchain RWA value reaching $2.0 billion in Q4, driven by a small number of large deployments, including USYC and BUIDL. Stablecoins also expanded, growing 9.2% QoQ and 121.4% YoY, supported by payments-focused initiatives and deeper integration with both DeFi and enterprise workflows.
Against this backdrop, Q4 reflected cyclical pressure rather than structural weakness. BNB’s price and circulating market cap fell 15.3% QoQ following October’s peak and subsequent deleveraging, though BNB remained the third-largest non-stablecoin crypto asset by market cap. Fee generation was volatile but strong, with total Q4 fees reaching $100.1 million, largely concentrated around the early-October liquidation window.
Network usage increased through the quarter, with average daily transactions rising 30.4% QoQ and daily active addresses up 13.3%. While October volatility led to activity spikes, baseline usage levels remained higher than in Q3, suggesting steady user growth over the year. On the technical front, 2025 upgrades materially improved performance, cutting block times from 3 seconds to 0.75, reducing finality, and lowering gas prices.
Looking ahead to 2026, BNB Chain’s roadmap emphasizes sustaining these gains. Priorities include higher sustained throughput, faster confirmations, continued fee efficiency through software optimization, and infrastructure capable of supporting growing state and institutional workloads. With RWAs, payments, and stablecoins increasingly central to network activity, BNB Chain enters 2026 positioned less as a speculative venue and more as a high-performance settlement layer, with near-term DeFi cyclicality balanced by longer-term structural expansion.

Alexander is a protocol researcher specializing in Layer-1 and Layer-2 infrastructure, as well as RWA's and Stablecoins. Before Messari, he worked at Jump Trading and Bull-Moose Consulting. He graduated from Northeastern University with a degree in Economics and Data Science, and helped run Northeastern's blockchain club.