Looking to dive deeper? Subscribe to Messari Pro. Messari Pro memberships provide access to daily crypto news and insights, exclusive long-form daily research, advanced screener, charting & watchlist features, and access to curated sets of charts and metrics. Learn more at messari.io/pro.
Quarterly ReportsLayer-1
State of Ethereum Q2 2025


Key Insights
- ETH rebounded 37% in Q2’25 to close at $2,487 (market cap $300.2B), aided by $4B in net inflows to spot ETFs. BlackRock’s ETHA (+48% to 1.75M ETH) led growth, while Grayscale’s ETHE continued to see outflows.
- Public companies accumulated over 1.2M ETH ($3.0B) in Q2, led by SharpLink Gaming (176,271 ETH), BitMine Immersion (300,657 ETH), and Bit Digital (100,603 ETH). Strategies emphasized staking and liquid staking, positioning ETH as an income-generating reserve asset.
- Circulating supply increased 0.1% QoQ to 120.7M ETH, with a 30-day annualized inflation rate of 0.7%. Network fees hit multi-year lows, down 37% in ETH terms (45,300 ETH) and 53% in USD ($102.3M), reflecting migration to L2s and alternative L1s.
- Total staked ETH rose 4% QoQ to 35.7M ETH (29.6% of supply), while USD-denominated stake value surged 43% to $89.25B. Distribution remained broad, with no operator above one-third control; Lido led with 9.0M ETH, while Ether.fi and Binance gained share.
- Arbitrum and Base captured 72% of L2 TVS, while Unichain grew 404% QoQ to $1.27B. DeFi TVL rose 33% QoQ to $62.4B, stablecoins added $1.1B in supply, and NFTs contracted 65%. The Pectra upgrade introduced smart account functionality, doubled blob capacity, and advanced Ethereum toward Danksharding.
Primer
Ethereum (ETH) is a distributed blockchain computing platform for smart contracts and decentralized applications. Ethereum’s smart contracts have enabled the creation of various new assets and industries, such as Decentralized Finance (DeFi), Non-Fungible Tokens (NFTs), Decentralized Autonomous Organizations (DAOs), and more. The Ethereum Virtual Machine (EVM) is the network’s execution engine optimized for smart contract processing.
Ethereum uses a Proof-of-Stake (PoS) consensus mechanism where users can run validators to secure the network and participate in block production. Anyone who meets the hardware requirements to run the latest execution and consensus clients and deposits at least 32 ETH into the Beacon Deposit Contract can permissionlessly operate an Ethereum validator.
Ethereum has chosen a scaling strategy whereby a network of Layer-2 (L2) networks meets the growing demand for blockspace. Through this strategy, Ethereum can scale while maintaining a high degree of decentralization as L2s rely on Ethereum security while solely focusing on transaction execution. The Dencun upgrade in Q1 2024 introduced “blobs” for data storage, significantly reducing L2 transaction fees. The Pectra upgrade that went live in May 2025 introduced EIPs that improve staking efficiency and L2 scalability.
Key Metrics
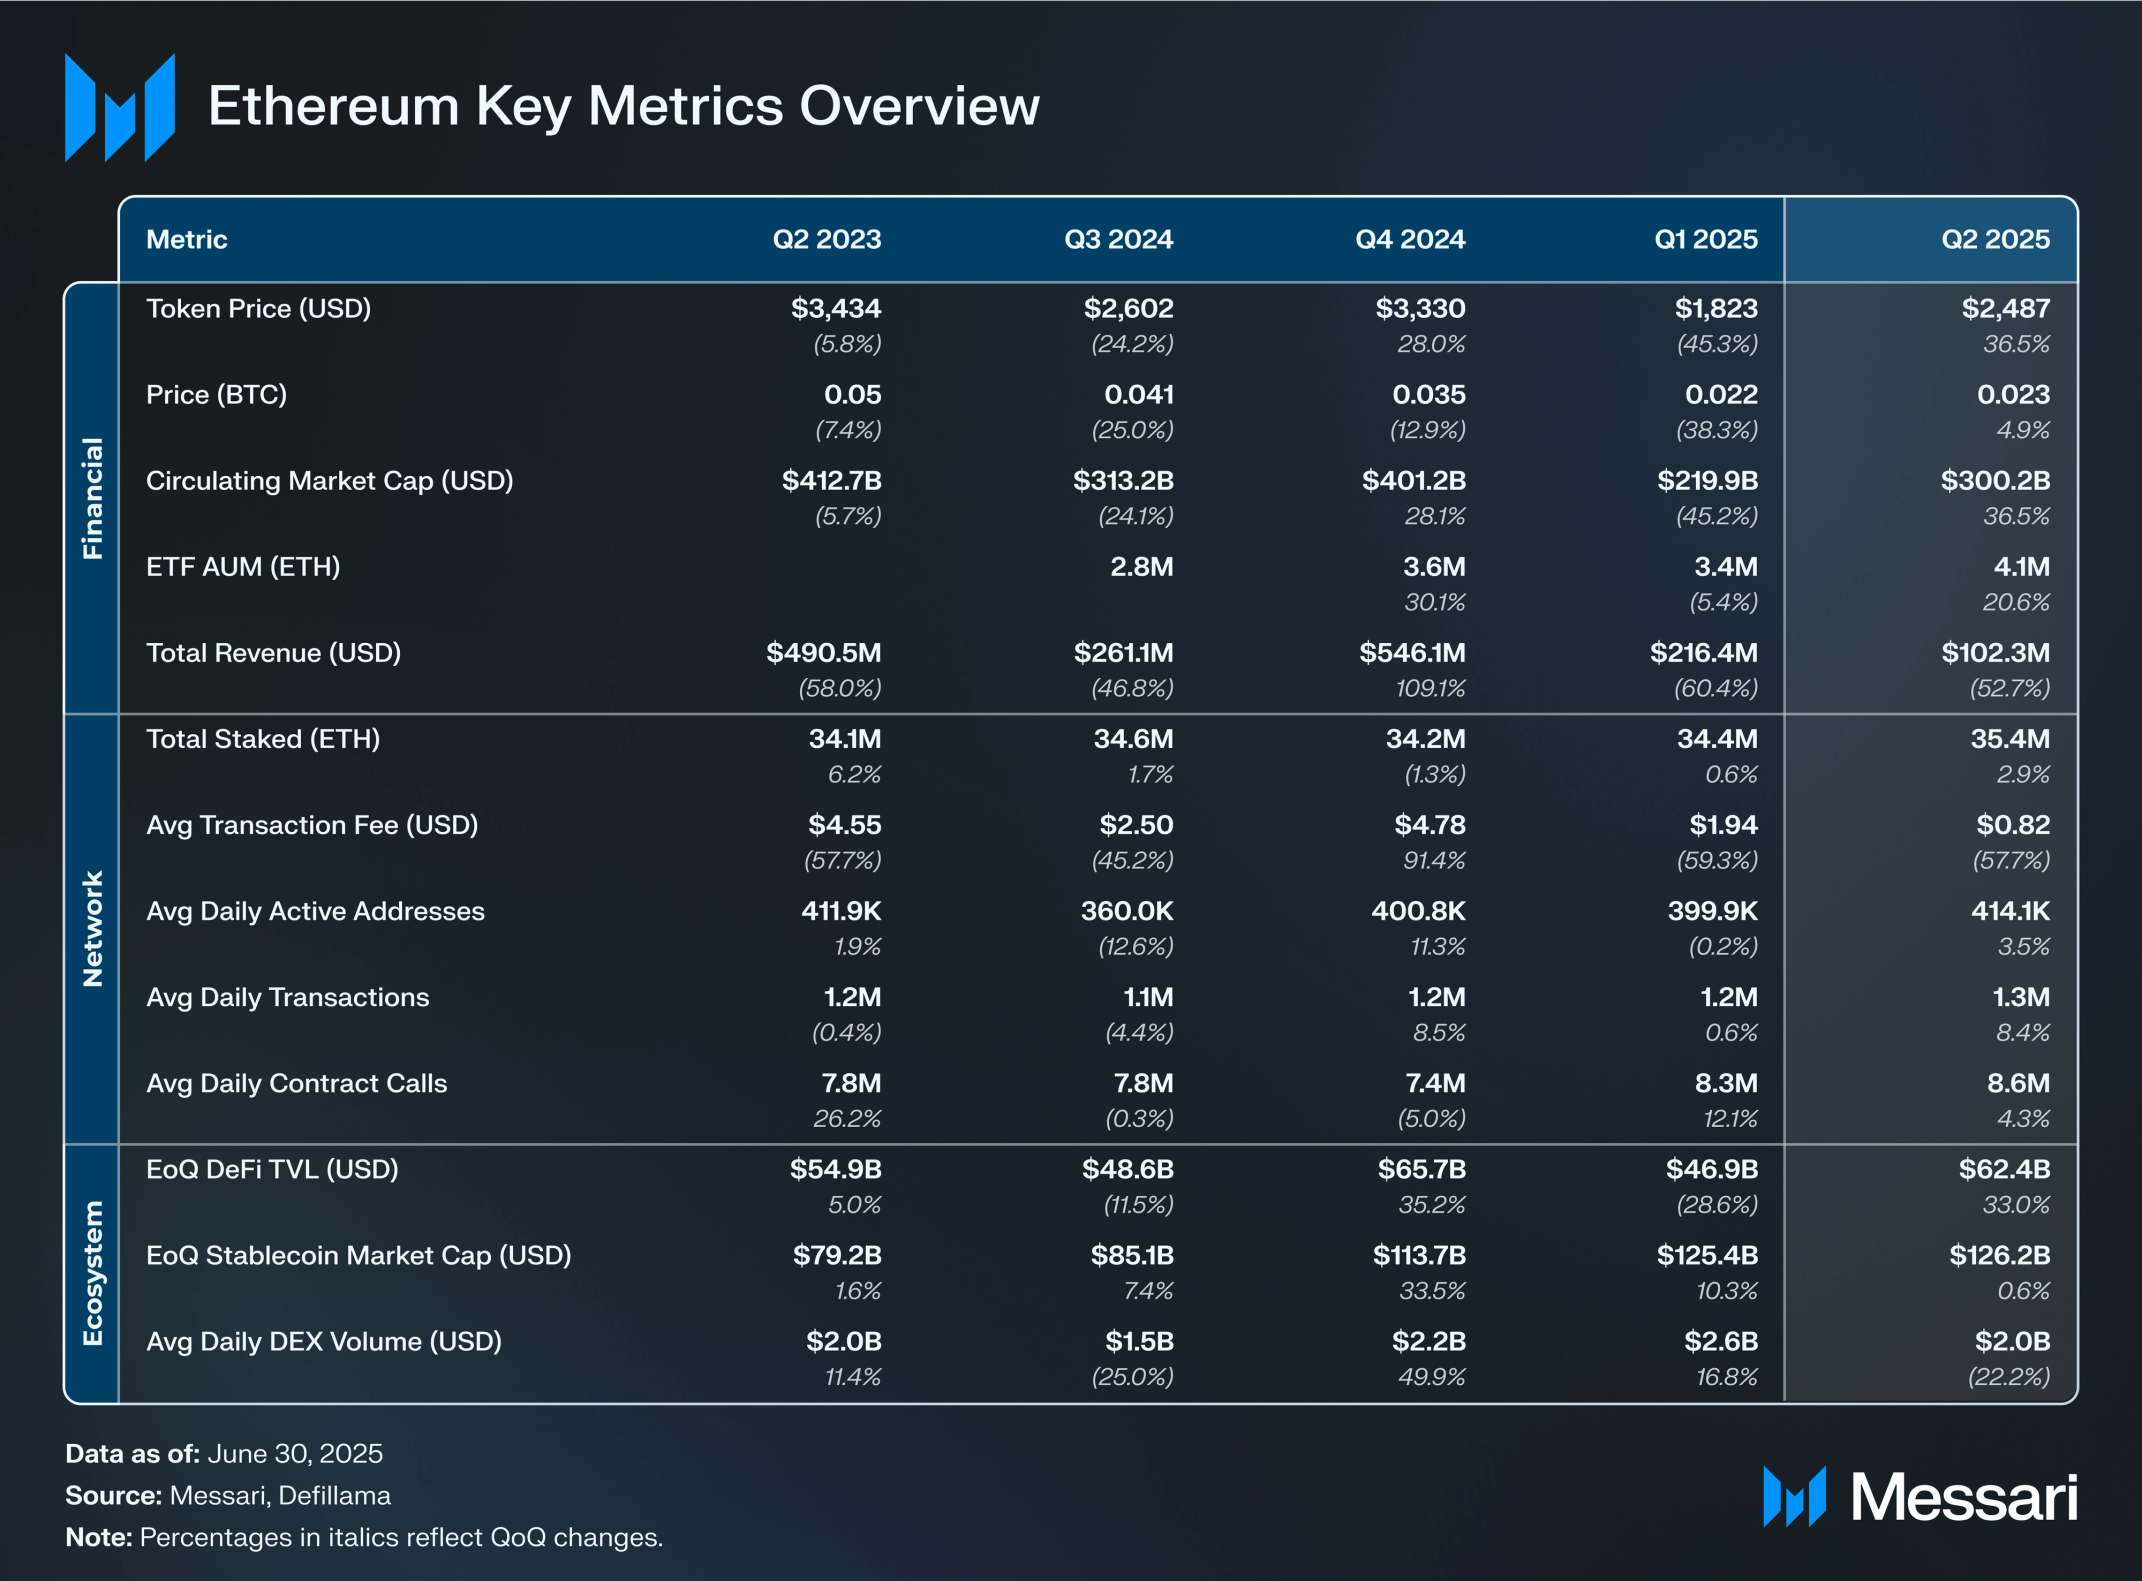
Financial Overview
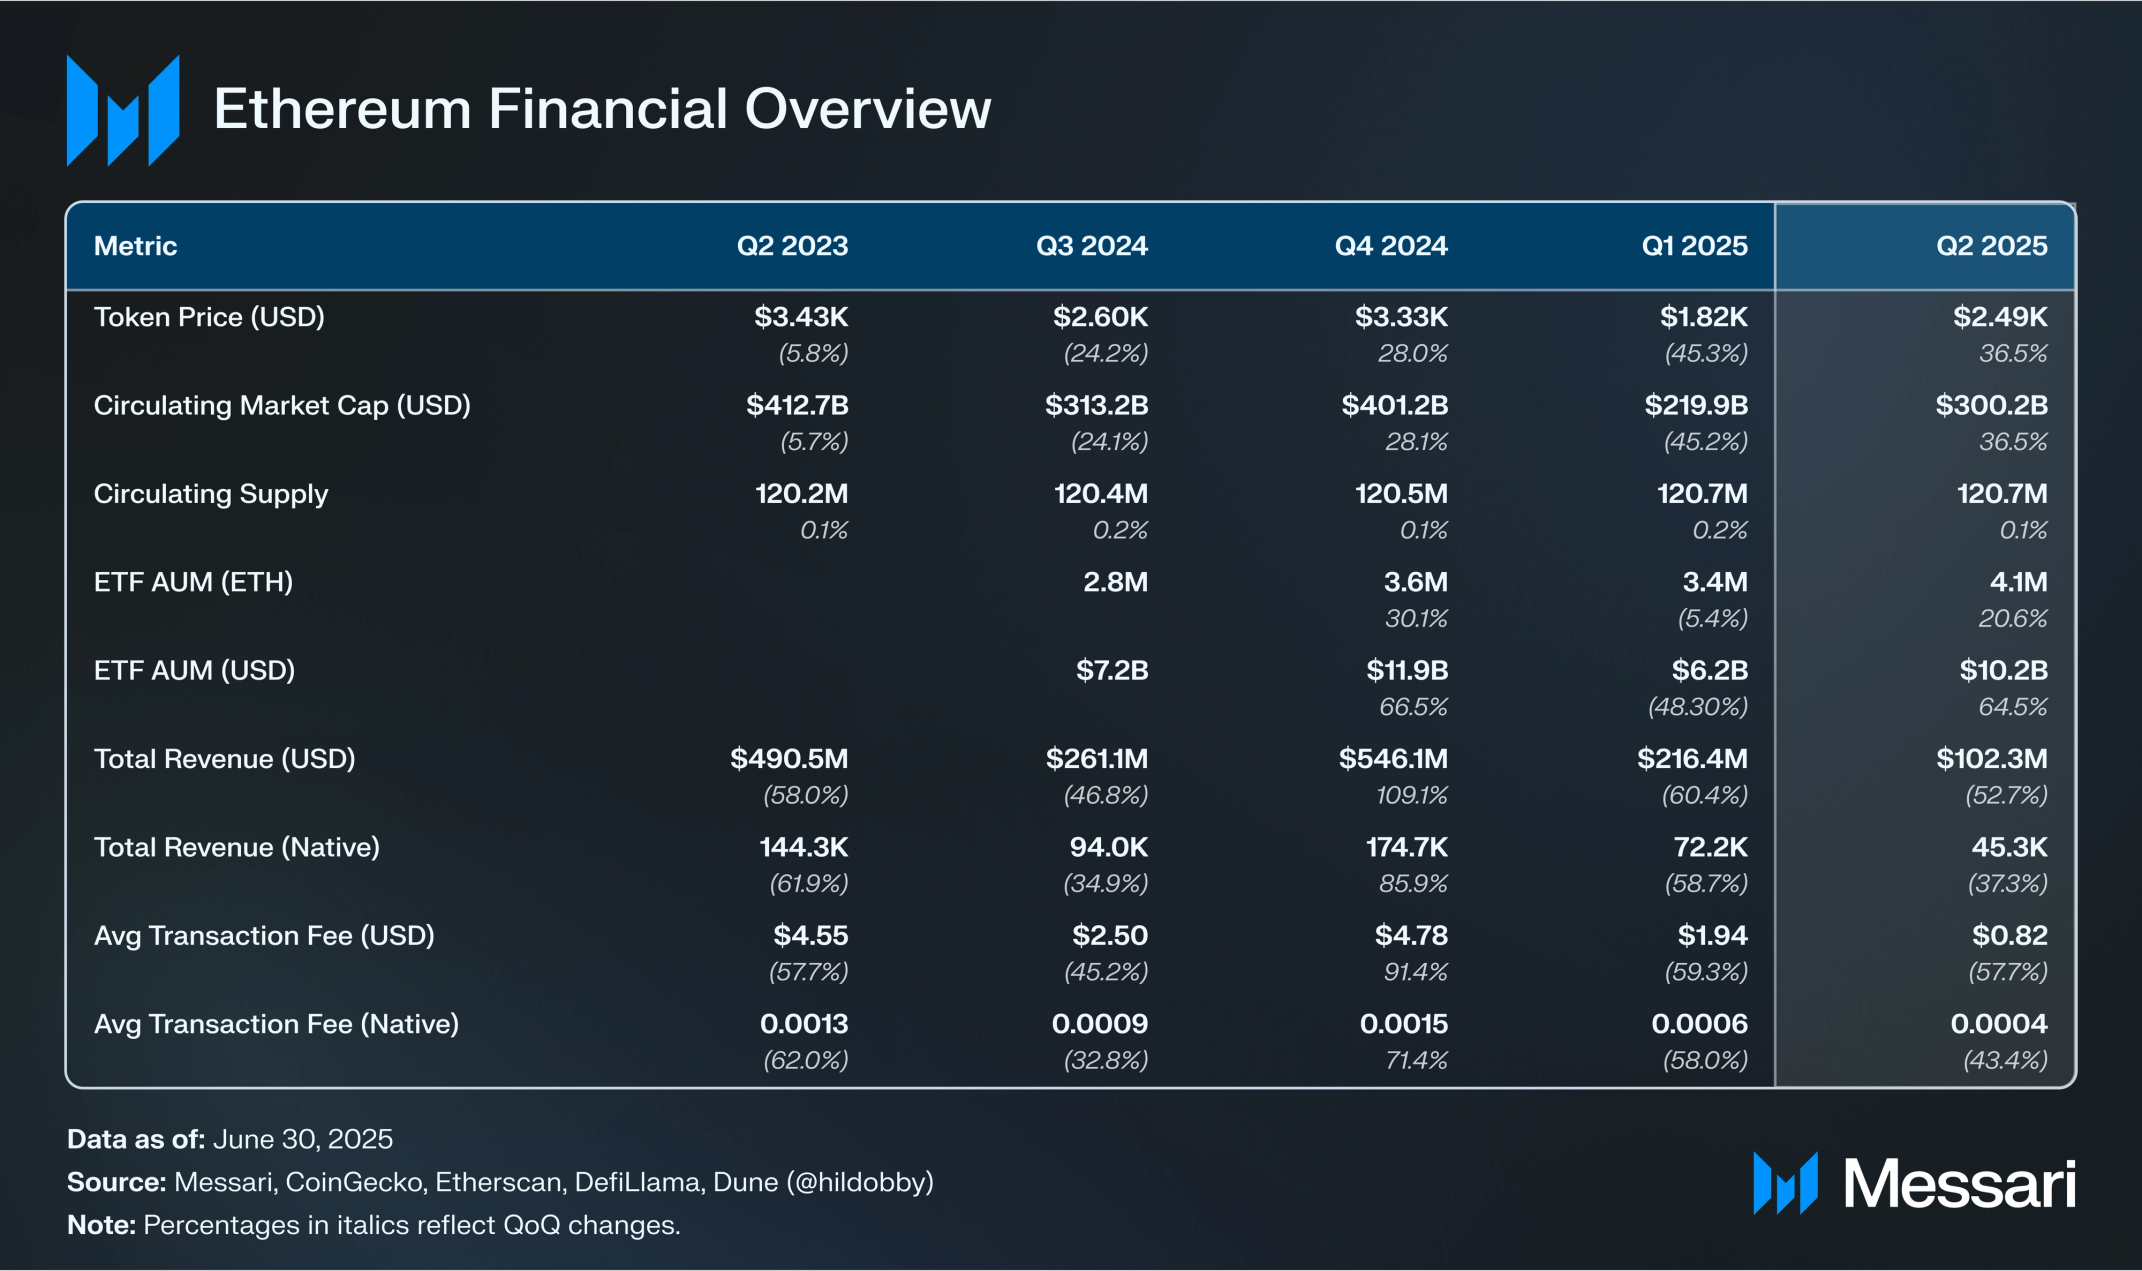
Market Cap and ETFs
After a rough Q1’25, where the price of ETH fell 45% QoQ from $3,330 to $1,823, ending March with a market cap of $219.9 billion, Ethereum rebounded in Q2’25. ETH’s price climbed 37% within the quarter to close at $2,487, while the market cap closed at $300.2 billion. For the first quarter in over a year, ETH outperformed BTC by 4.9% QoQ. BTC set a new all-time high at $112,000 before finishing the quarter at $107,200, up 29.9% QoQ. Additionally, ETH outperformed competing L1s such as SOL (+11%), TRX (+16%), and BNB (+26%).
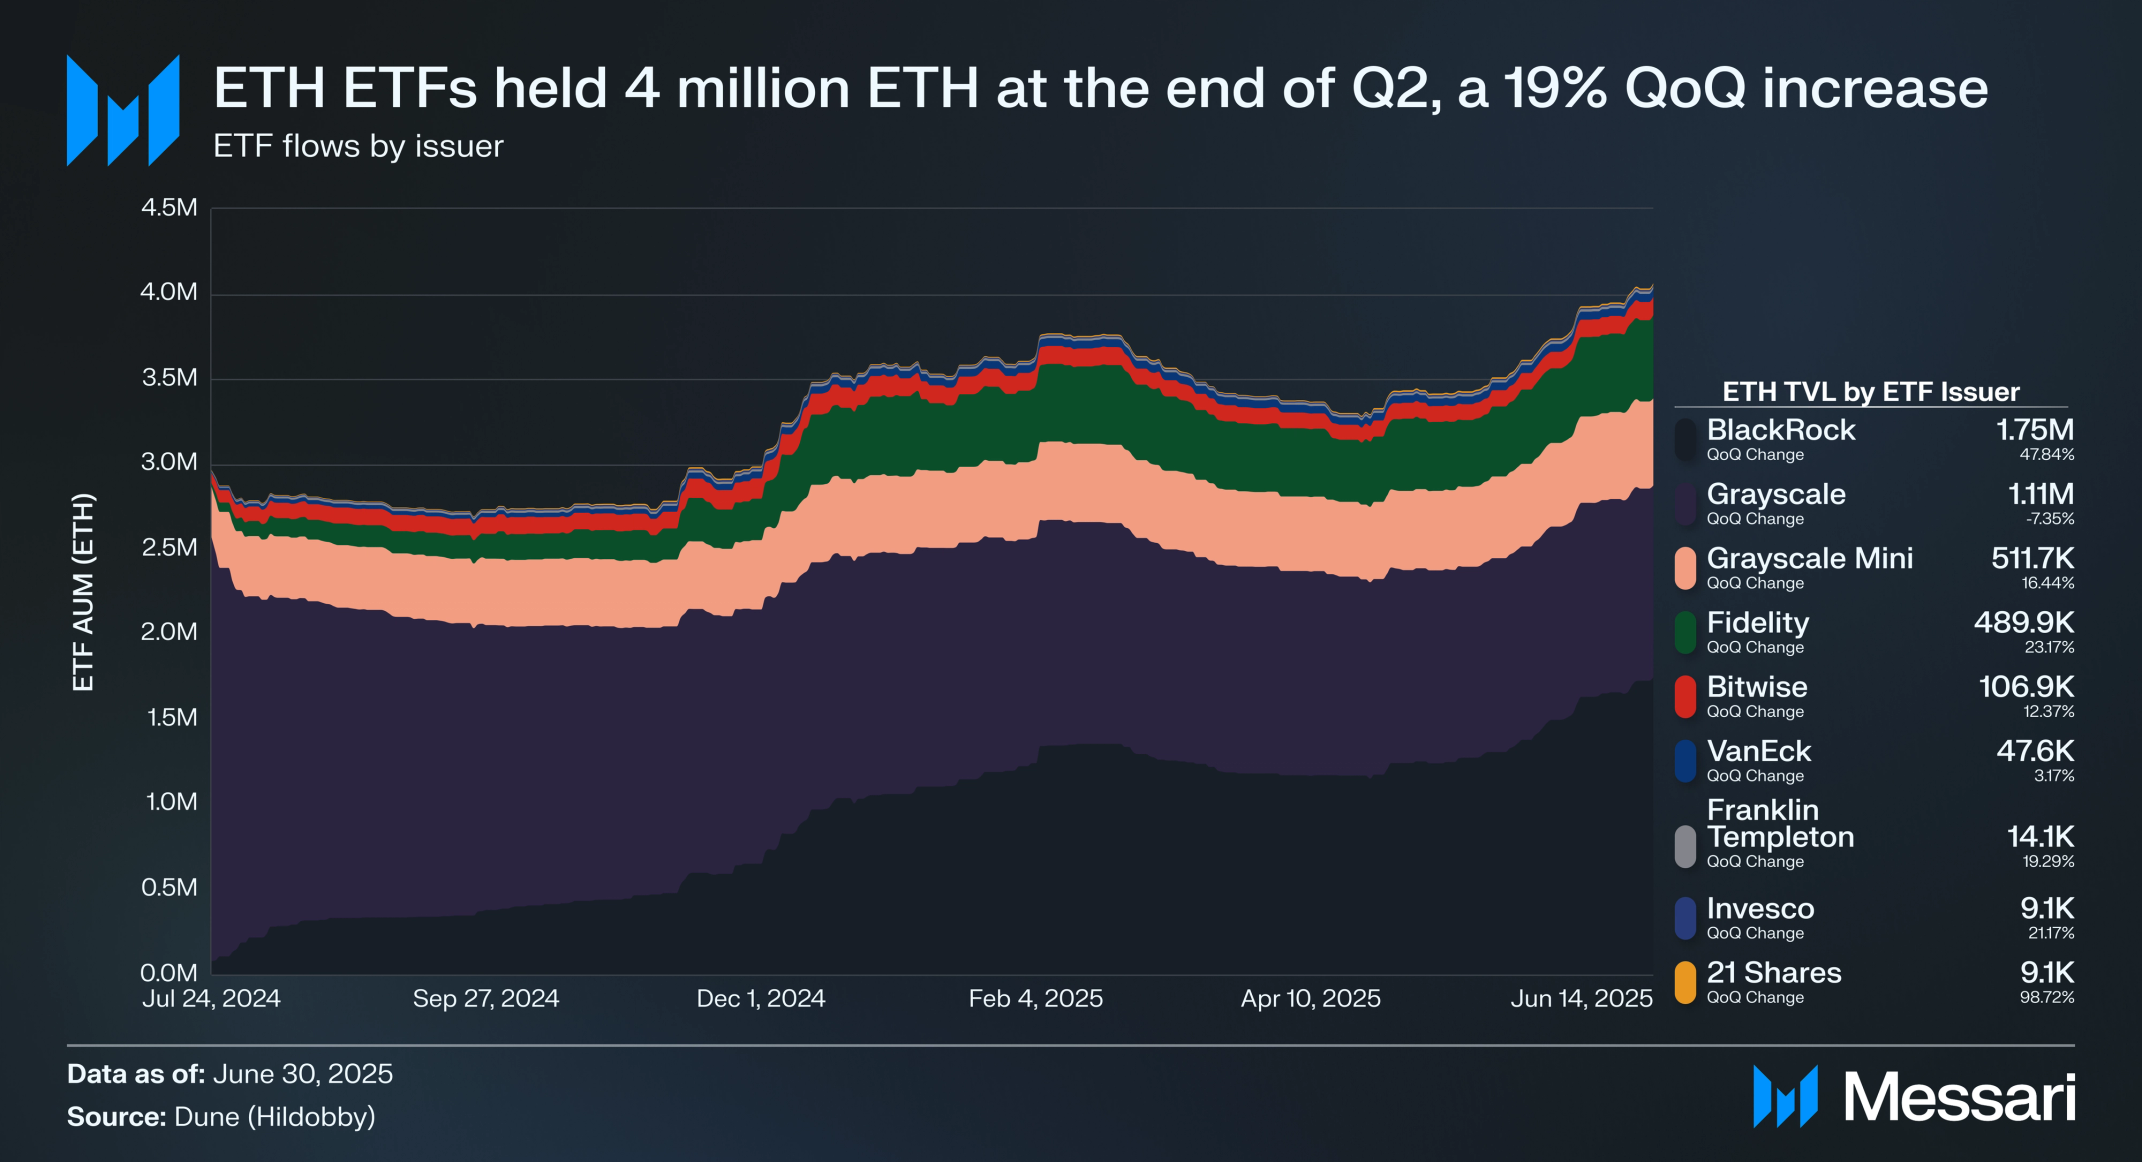
Ethereum spot ETFs had strong net inflows in Q2’25, with total AUM in ETH growing 19% QoQ, from 3.4 million ETH at the end of March to 4.1 million ETH by June 30. Measured in USD, the growth was even more significant, growing 65% QoQ from $6.2 billion to $10.2 billion. Leading the charge was BlackRock’s ETHA, which increased holdings by 48% to 1.75 million ETH, reinforcing its position as the largest ETH ETF. Fidelity’s FETH also received substantial inflows, up 23% to 489,900 ETH. Meanwhile, Grayscale’s ETHE experienced continued outflows, declining 7% QoQ to 1.13 million ETH, though this was partly offset by a 16% gain in Grayscale Mini, which ended the quarter at 511,700 ETH. Other notable gainers included 21 Shares (99%), Invesco (21%), and Franklin Templeton (19%), all of which significantly boosted their ETH exposure. Combined, BlackRock and the Grayscale suite continued to represent the majority of ETH ETF AUM by quarter-end, with a more diversified flow picture than in prior quarters.
The Rise of Ethereum Treasury Companies
In Q2 2025, several publicly traded firms unveiled Ethereum treasury strategies, mirroring existing BTC treasury strategies. Collectively, they accumulated 1.2 million ETH ($3.0 billion) by the end of the quarter, which positioned Ethereum as a central asset in corporate balance sheets. This growth is expected to accelerate into Q3.
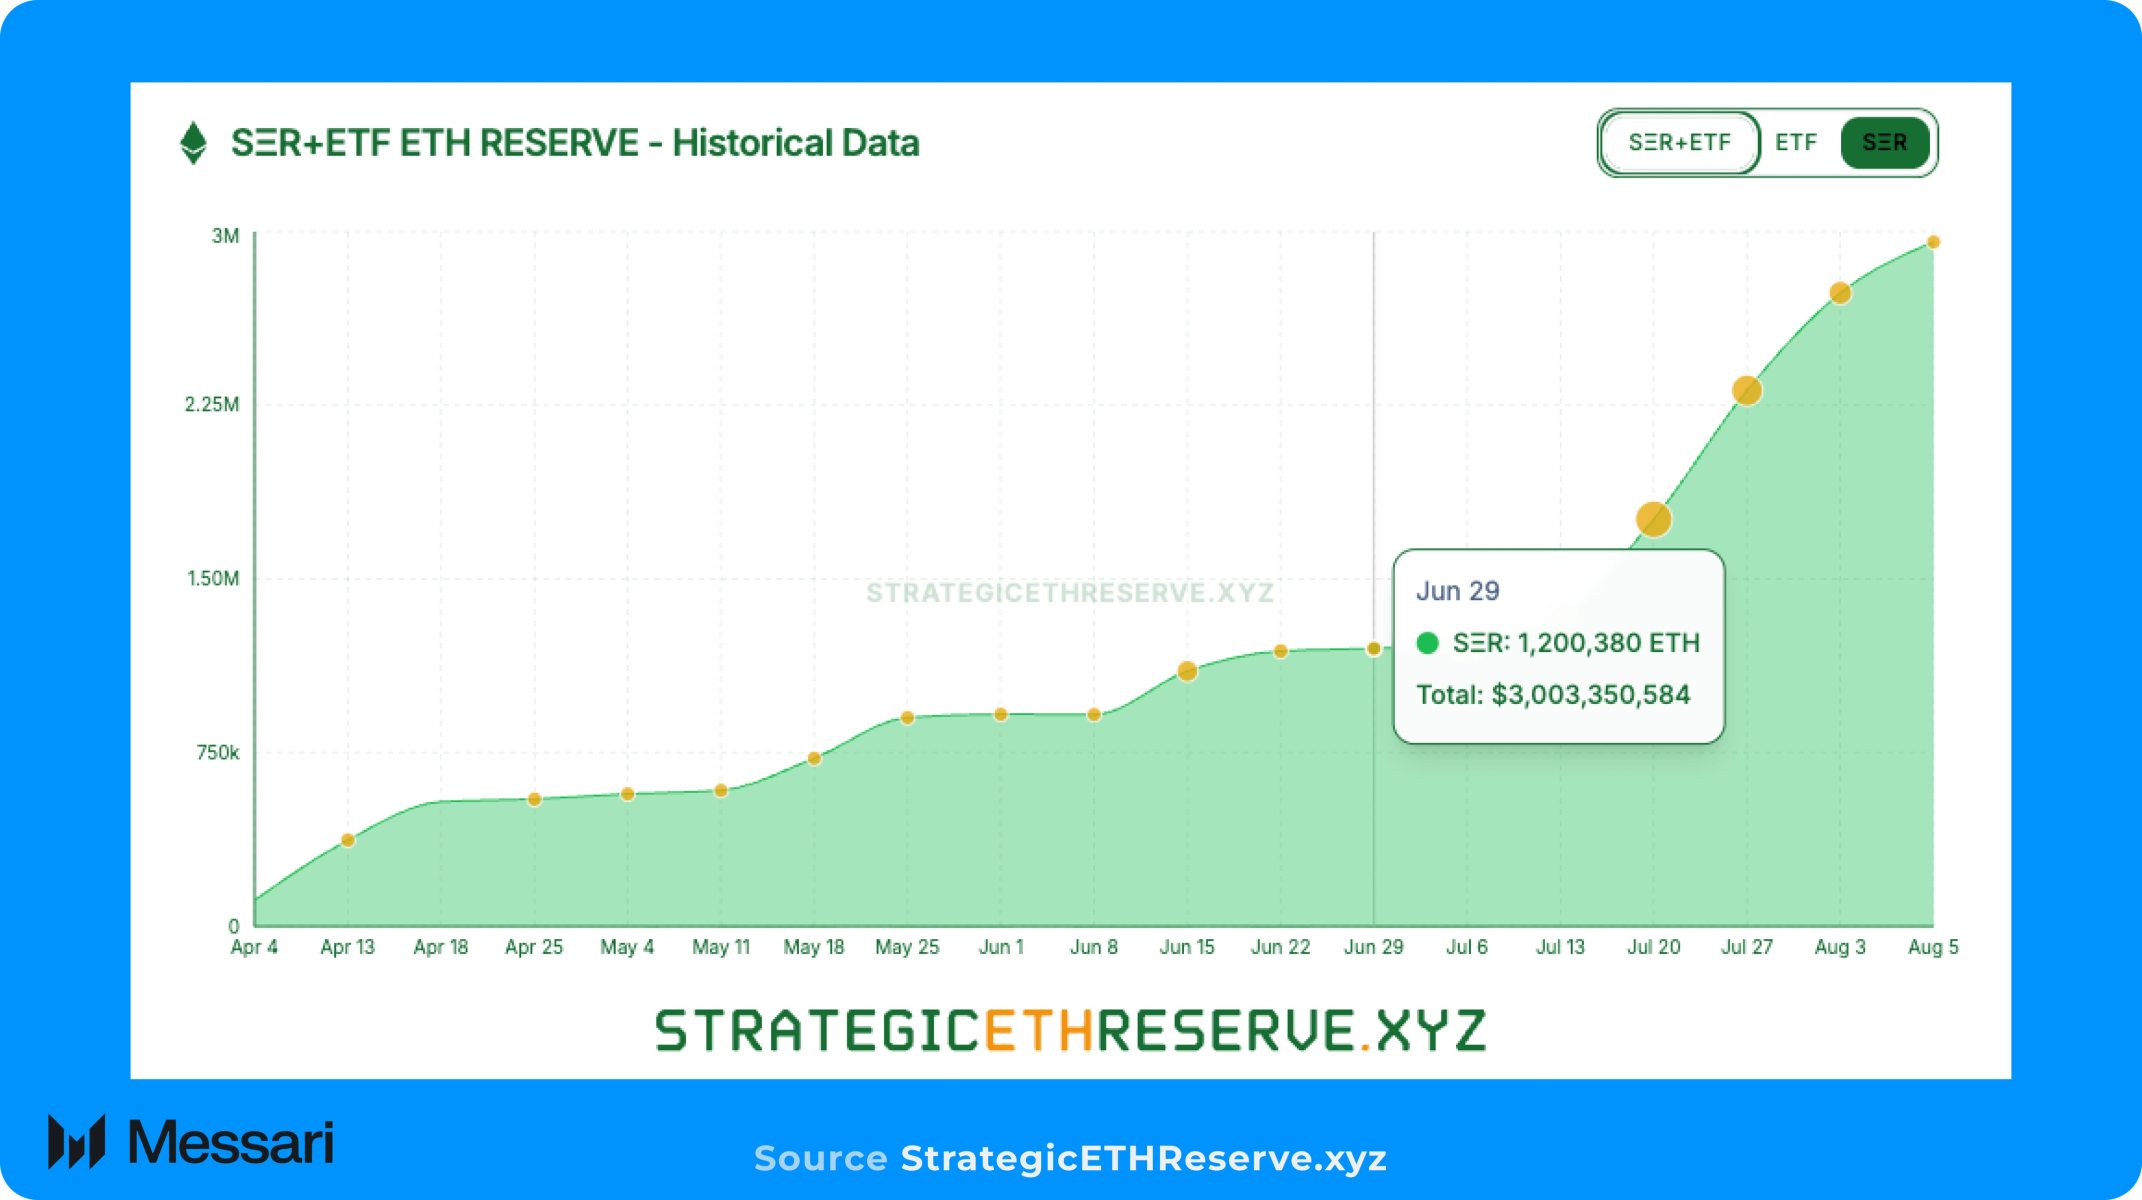
- SharpLink Gaming (NASDAQ: SBET) announced the acquisition of 176,271 ETH ($463 million) in mid‑June, making it the largest publicly traded Ethereum treasury holder. Over 95% of those ETH are actively staked or deployed in liquid staking platforms, reflecting a long-term, income-generating approach.
- Bit Digital (NASDAQ: BTBT) fully pivoted its treasury from Bitcoin to Ethereum. By selling 280 BTC and using proceeds from a $172 million equity raise, the firm increased its holdings to approximately 100,603 ETH by early July, up significantly from 24,434 ETH at the end of March.
- BitMine Immersion Technologies (NYSE: BMNR) launched a high‑profile Ethereum treasury strategy in late June and July 2025. As of mid-July, it held 300,657 ETH, valued at over $1.1 billion, backed by an aggressive acquisition goal of eventually owning 5% of Ethereum’s total supply (6 million ETH).
- BTCS Inc. (NASDAQ: BTCS) acquired 3,450 ETH ($8.4 million) in May, bringing its total holding to approximately 55,788 ETH. The company has filed a shelf registration to raise up to $2 billion to fund further ETH purchases.
Additional companies like Coinbase, GameSquare, Exodus Movement, IntChains, and Vault Ventures reportedly hold ETH in the low tens of thousands, though no new Q2 announcements clarified incremental purchases.
Supply Dynamics and Fees
The circulating supply of ETH is dynamically adjusted:
- Issuance - Ethereum mints new ETH tokens, otherwise known as the “base reward.” This reward is dynamic and is a function of the total amount of ETH staked and attesting validators.
- Burn - On Aug. 5, 2021, the ”London” hard fork went live, adding EIP-1559. This network upgrade activated a fee burn mechanism that burns a portion of every network transaction fee users pay.
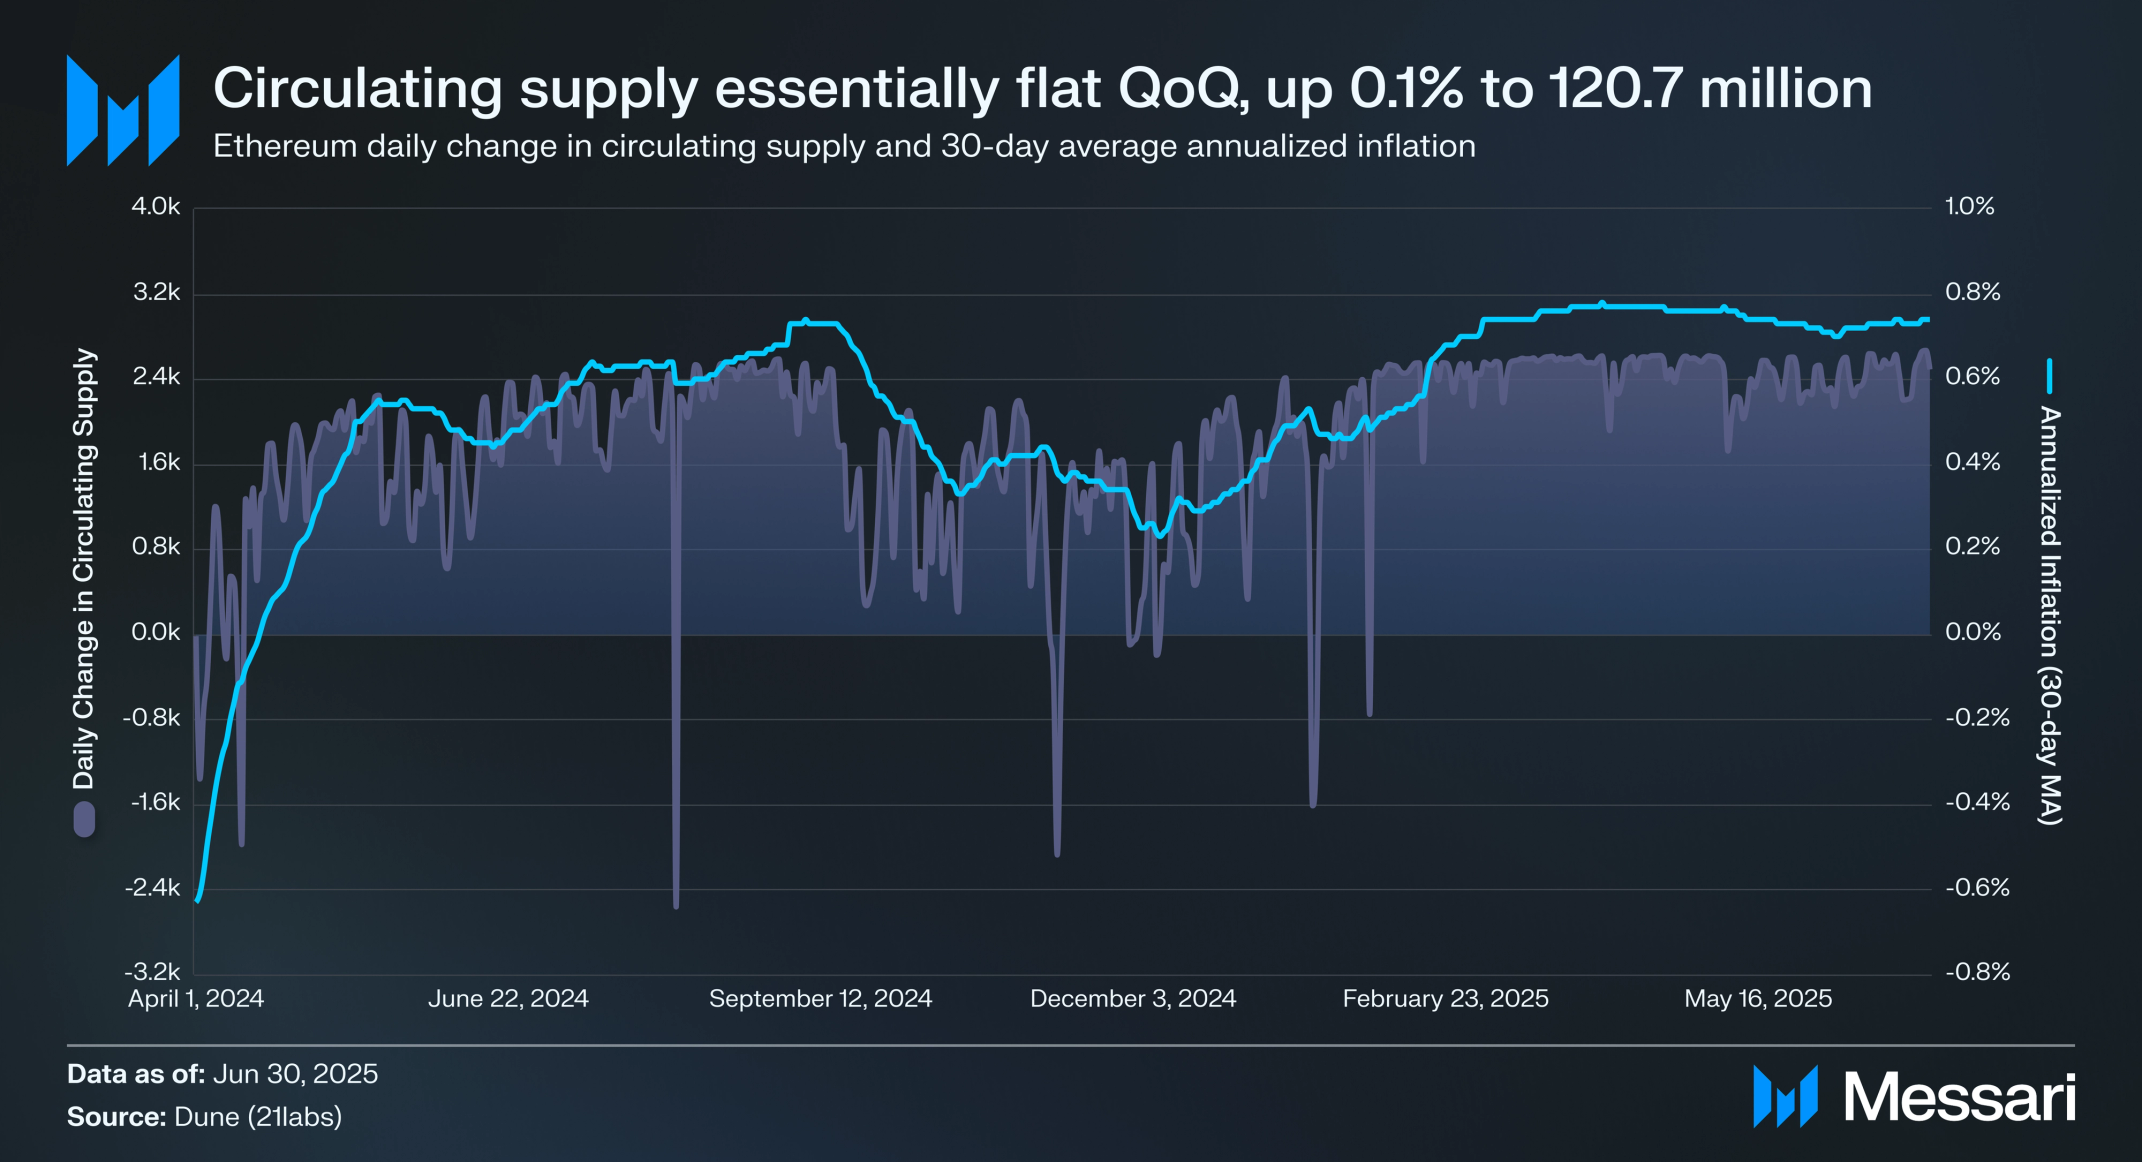
As such, when issuance is greater than burn, Ethereum’s circulating supply is inflationary. Circulating supply has been increasing since Q2’24 due to decreasing network usage. As for Q2’25, Ethereum’s circulating supply increased by 0.1% QoQ to 120.7 million. Furthermore, the 30-day moving average of Ethereum’s annualized inflation rate stood at 0.7% (down 4% QoQ) by quarter end.
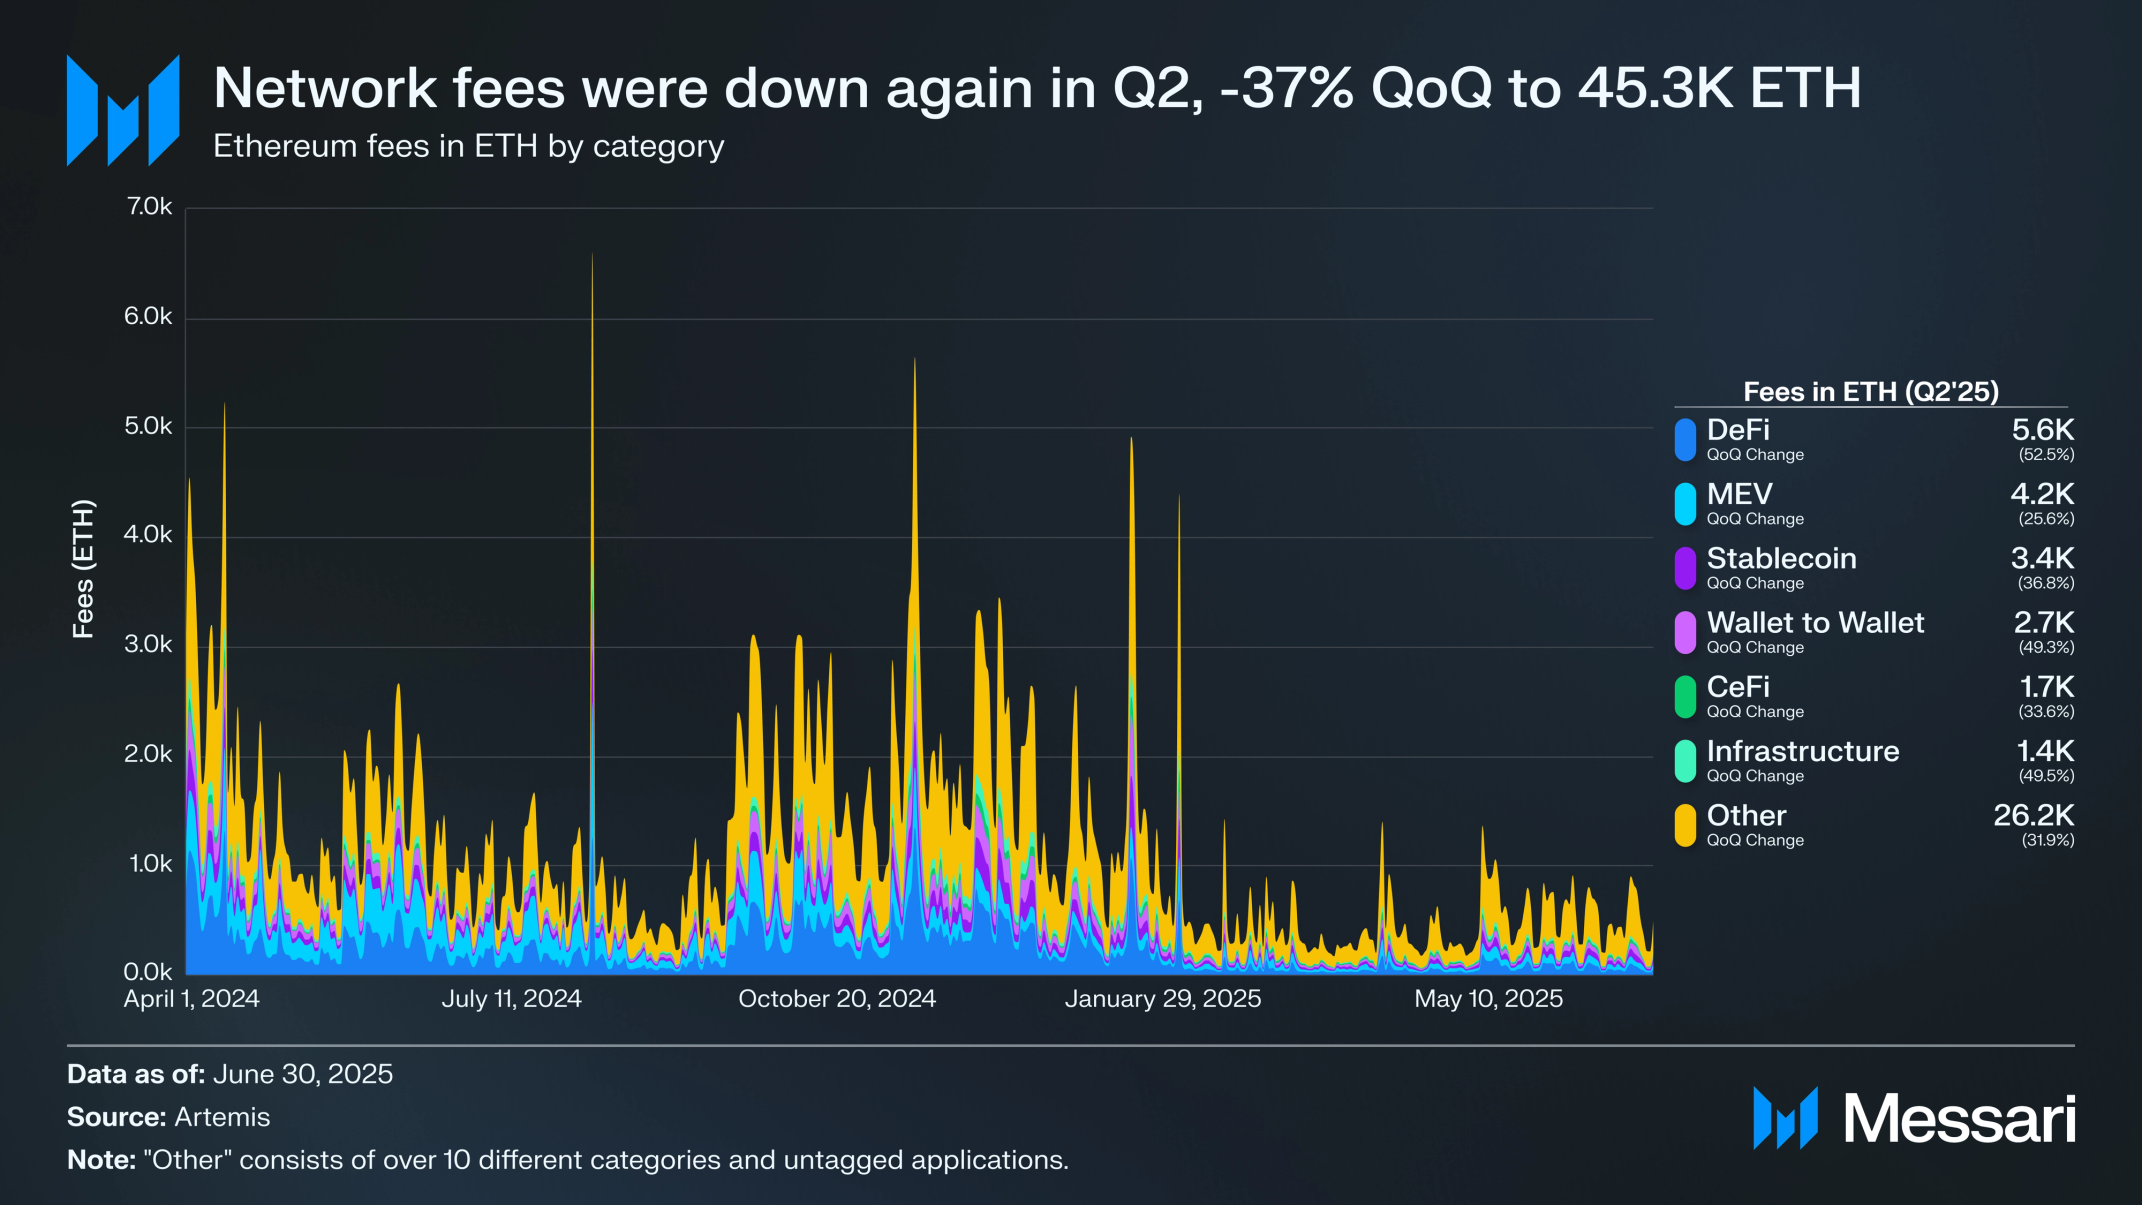
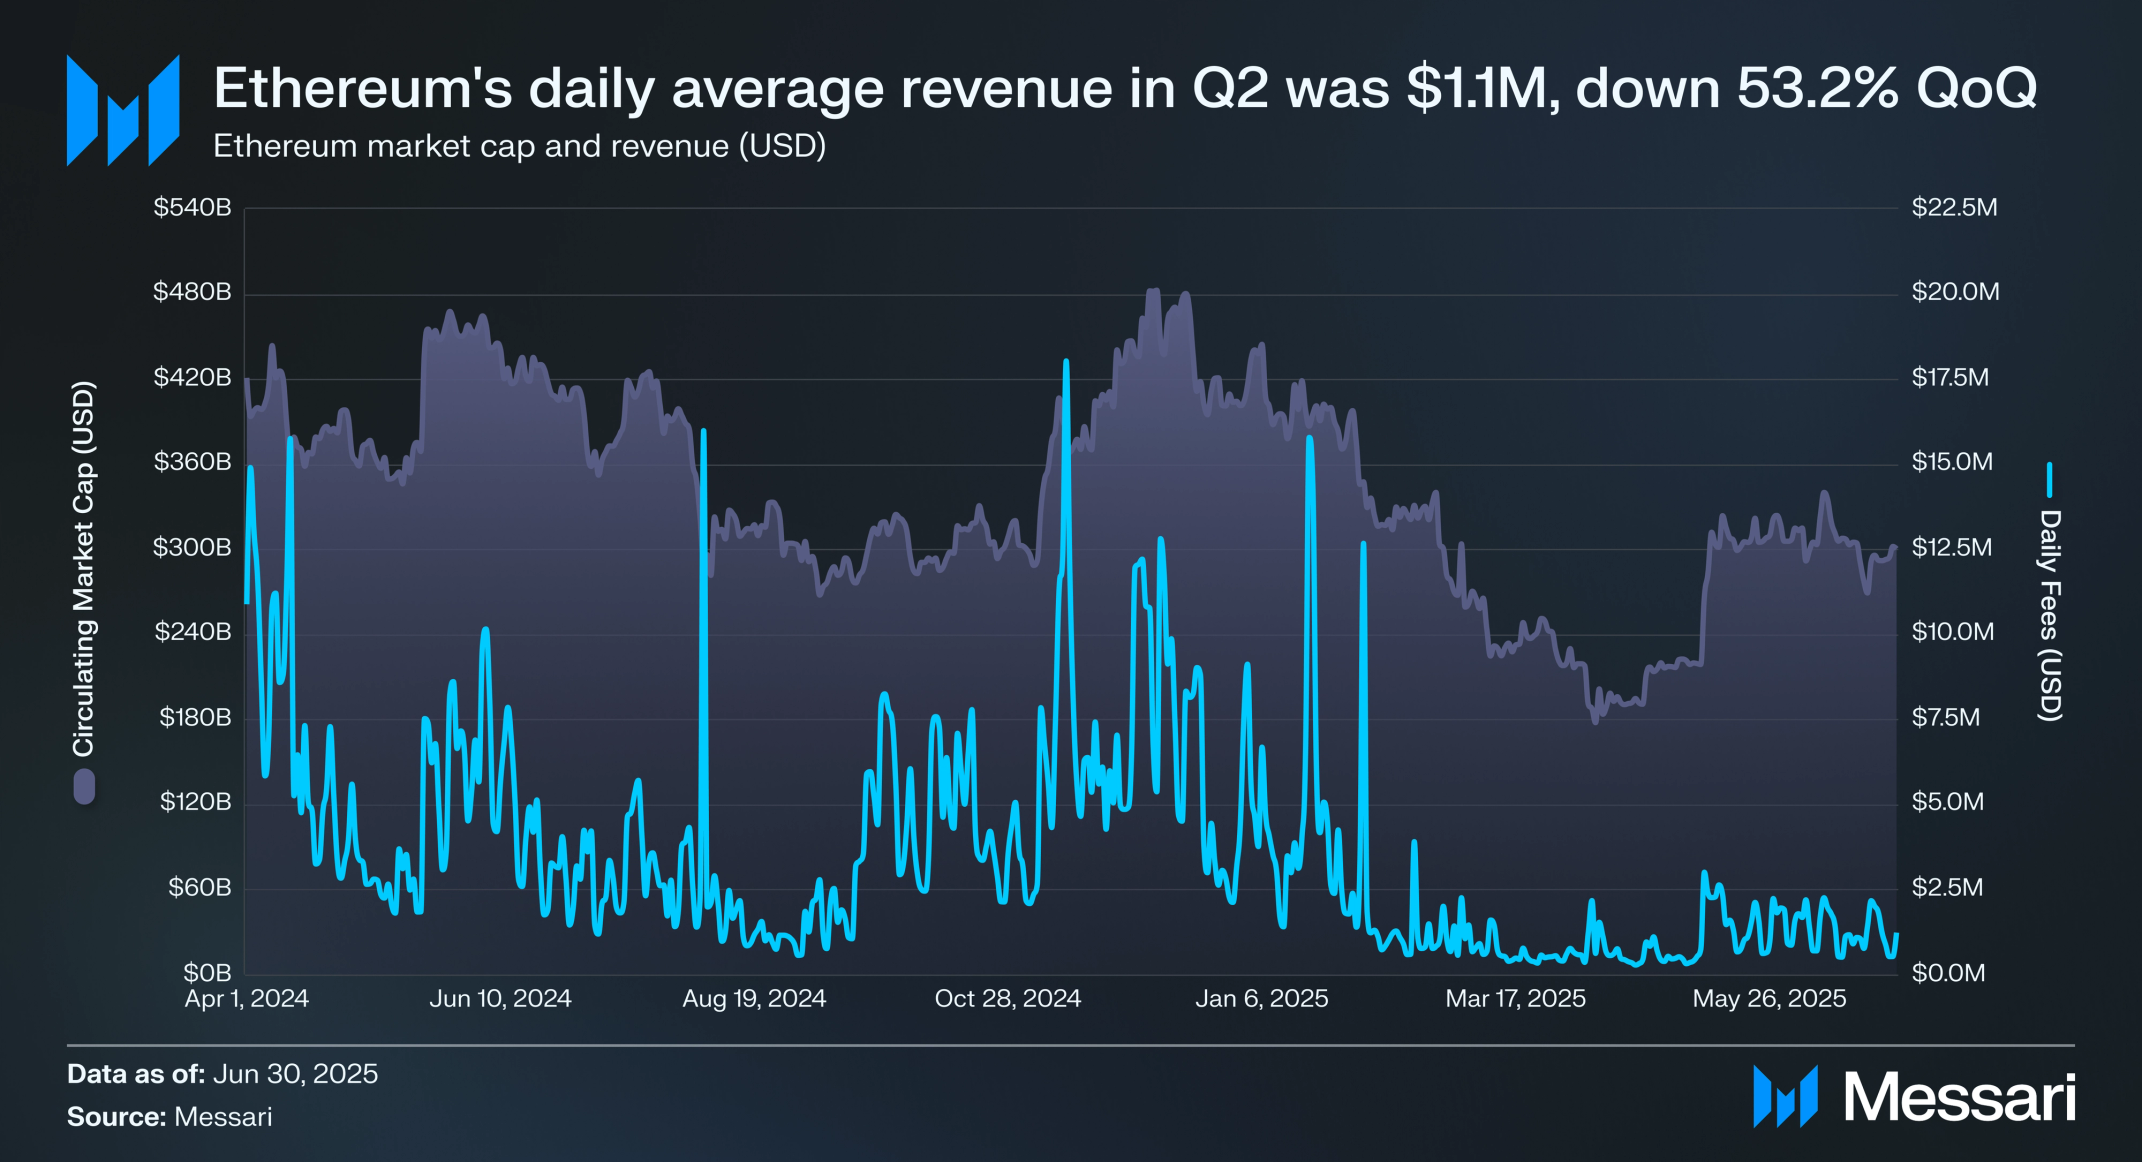
Network fees on Ethereum have been in secular decline since they peaked during the last bull market in Q4’21. In Q2’25, network fees reached multi-year lows in both ETH and USD. Network fees in ETH declined 37% QoQ from 72,200 to 45,300, while network fees in USD declined 53% QoQ from $216.4 million to $102.3 million. The main cause for this decrease in network fees has been due to users’ shifting activity from Ethereum L1 to Ethereum L2s, and other L1s taking market share. TRON ($165.2 million) and Solana ($121.2 million) were the only L1s with more network fees in Q2. Furthermore, no individual category had an increase in fees in Q2:
- DeFi - down 53% to 5,600 ETH
- MEV - down 26% QoQ to 4,200 ETH
- Stablecoin - down 37% QoQ to 3,400 ETH
- Wallet to Wallet - down 49% QoQ to 2,700 ETH
- CeFi - down 34% QoQ to 1,700 ETH
- Infrastructure - down 50% QoQ to 1,400 ETH
Network Overview
Onchain Activity
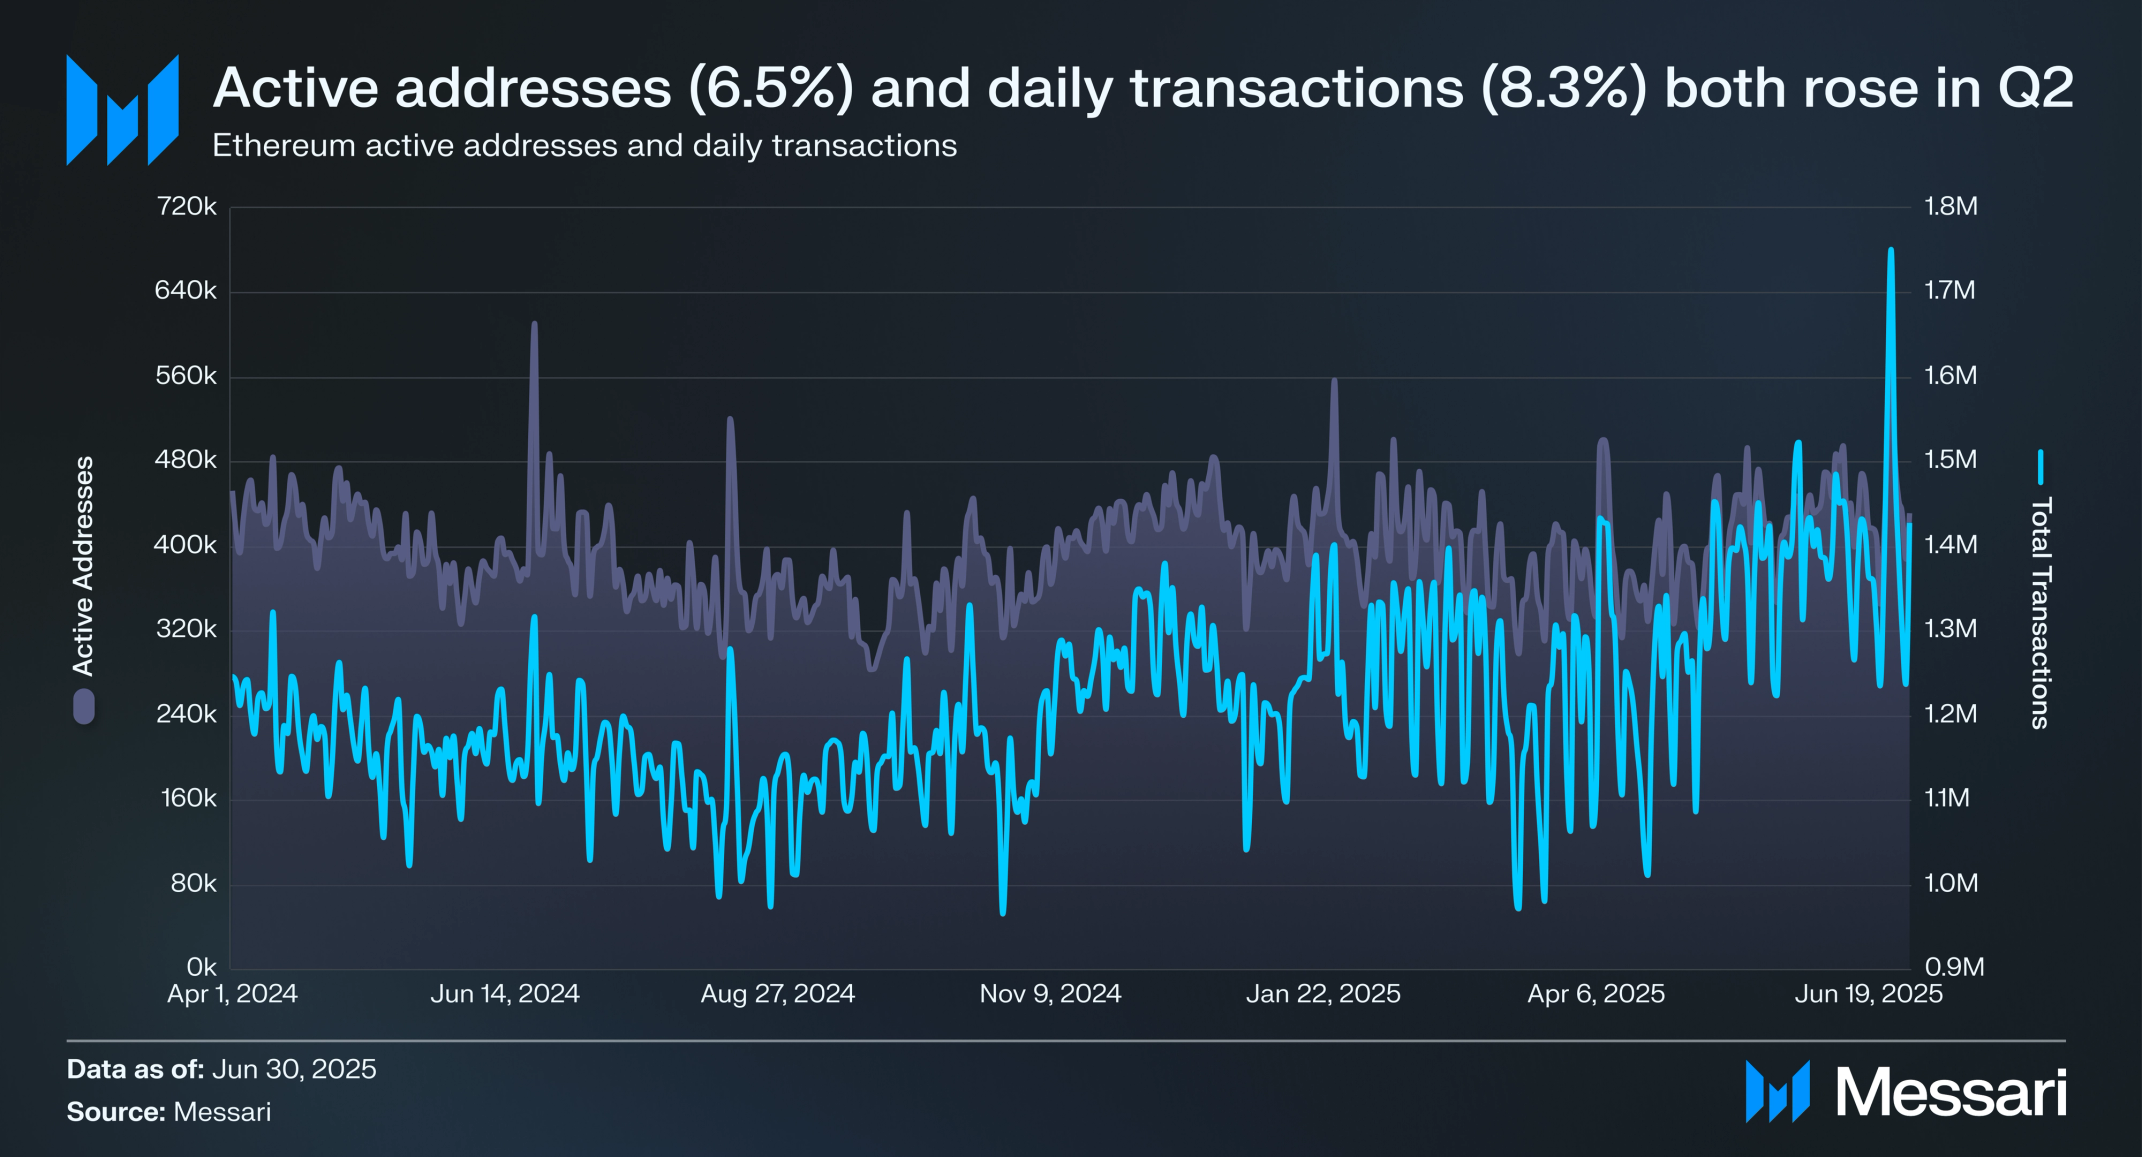
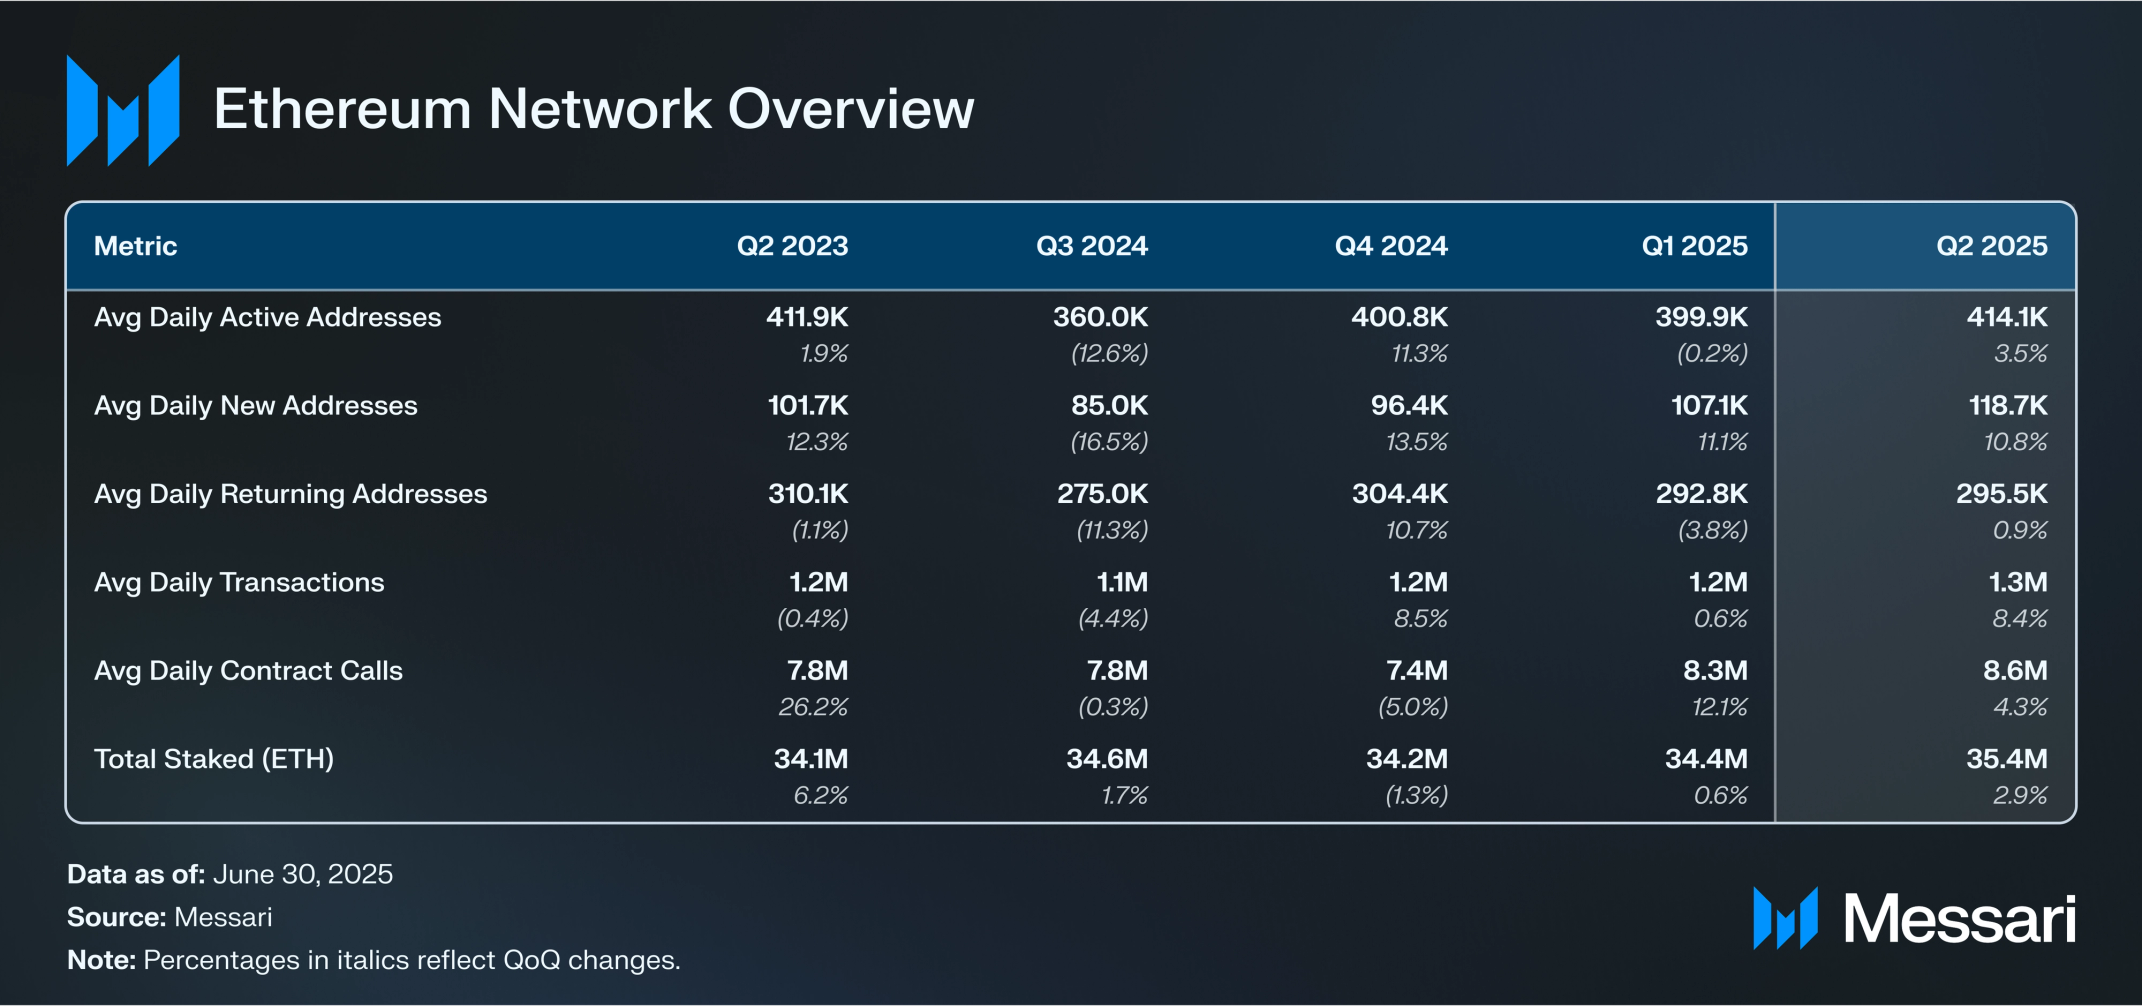
In February 2025, Ethereum validators voted to increase the gas limit per block from 30 million to 36 million, the first such increase since August 2021. An increase in gas limit increases transactional capacity for Ethereum. As a result of this increased capacity, onchain activity on Ethereum rose modestly in Q2’25. Daily average transactions increased 8% QoQ, from 1.32 million at the end of Q1 to 1.43 million by June 30. This marks the first meaningful uptick after four quarters of relatively flat transaction volume around the 1.2 million level.
Active addresses also increased, growing 7% QoQ from 404,900 to 431,200. The rise suggests a broader re-engagement from users and developers, likely influenced by new application launches, revived DeFi activity, and increased experimentation with real-world assets (RWAs) and staking strategies. While growth remains gradual, the upward trend points to early signs of renewed user momentum on Ethereum’s base layer.
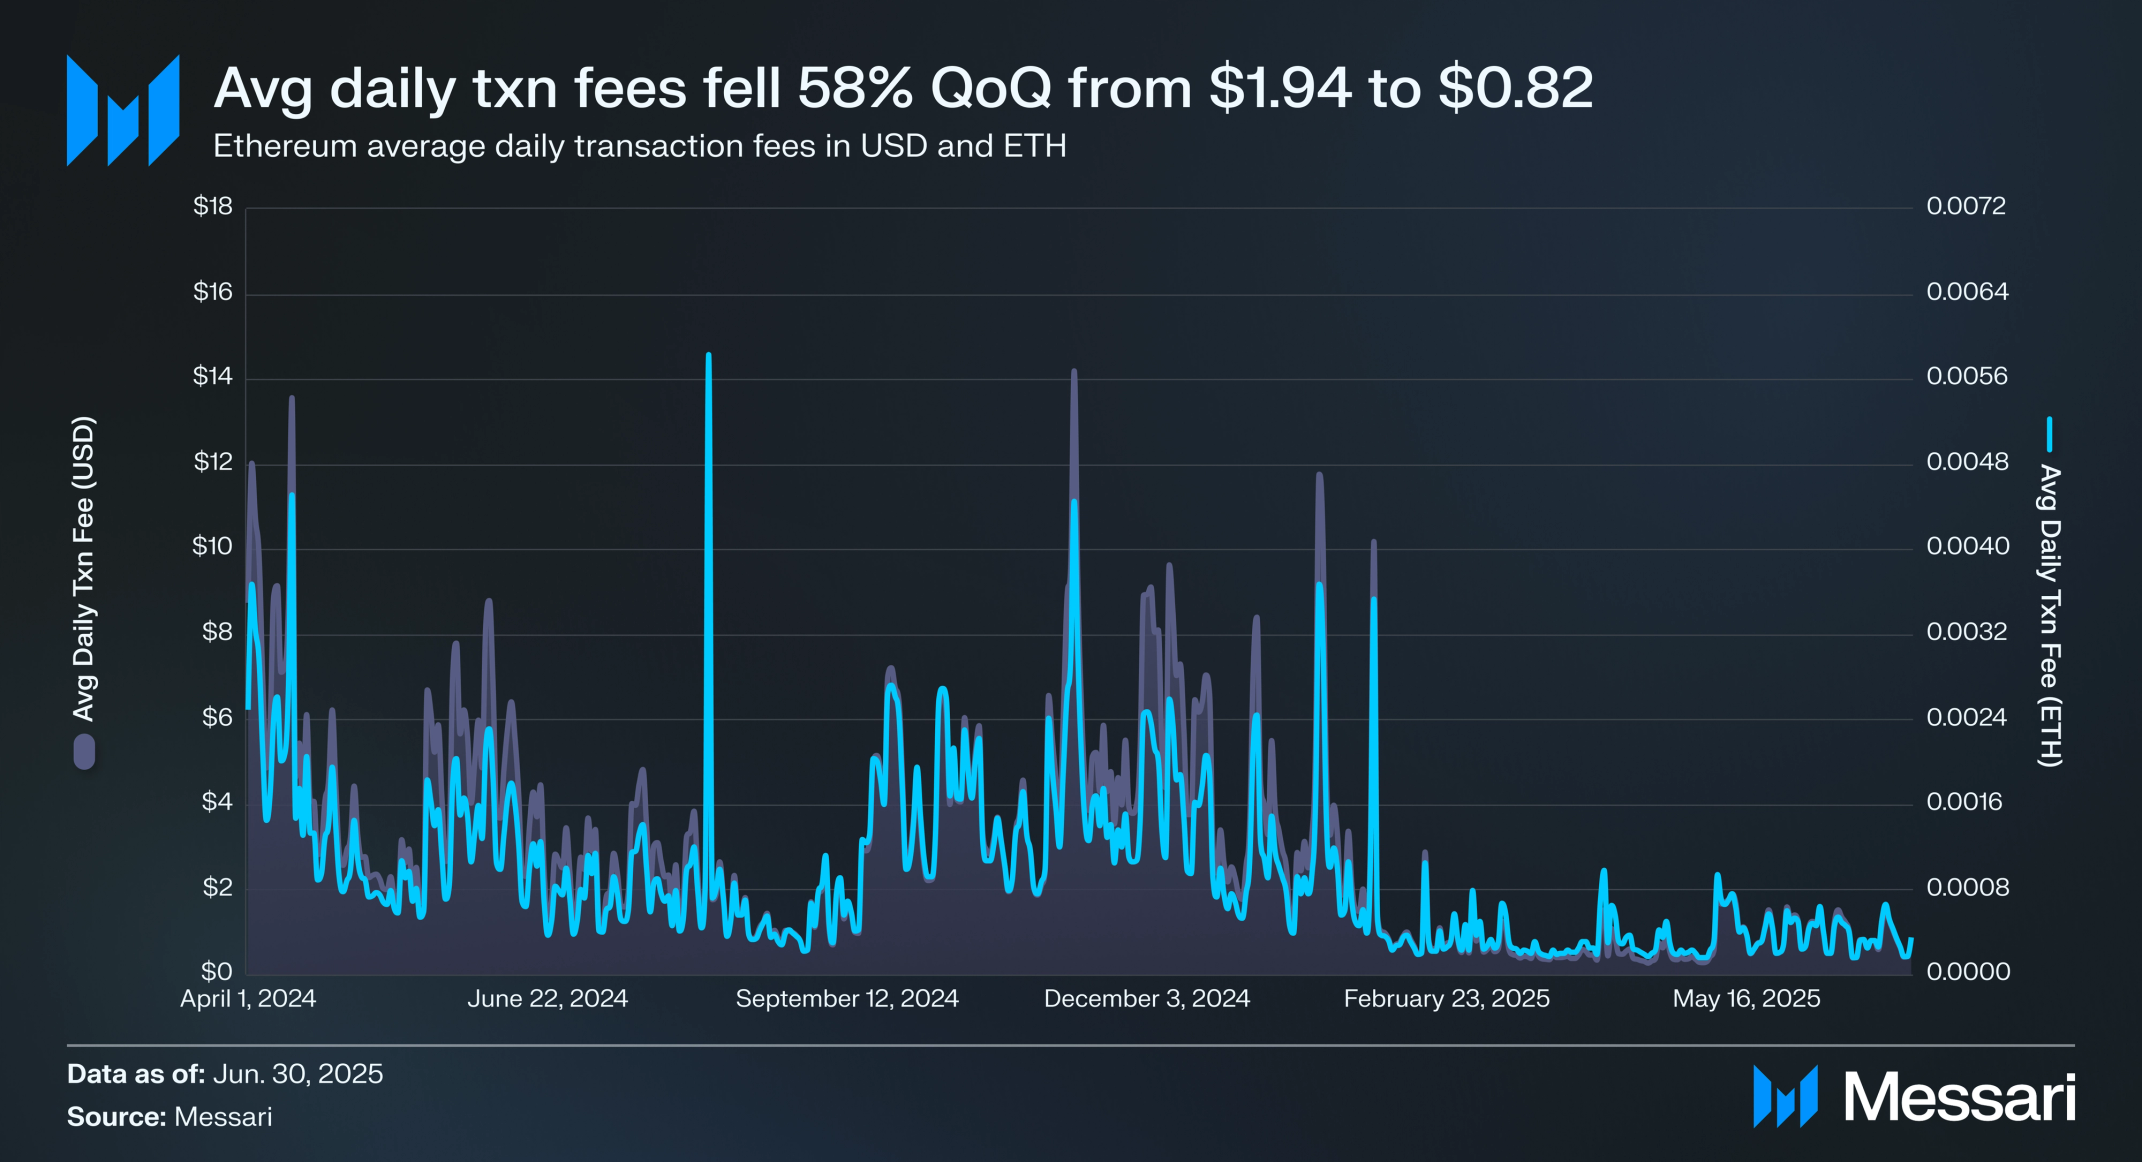
Ethereum transaction fees consist of a base fee, which adjusts automatically based on network demand and is burned, and a priority fee, an optional tip given to validators to encourage faster inclusion in a block. With demand for Ethereum blockspace decreasing and blockspace capacity increasing, Q2 daily average transaction fees in ETH were down 44% QoQ to 0.00037 ETH, while fees in USD were down 58% QoQ to $0.82.
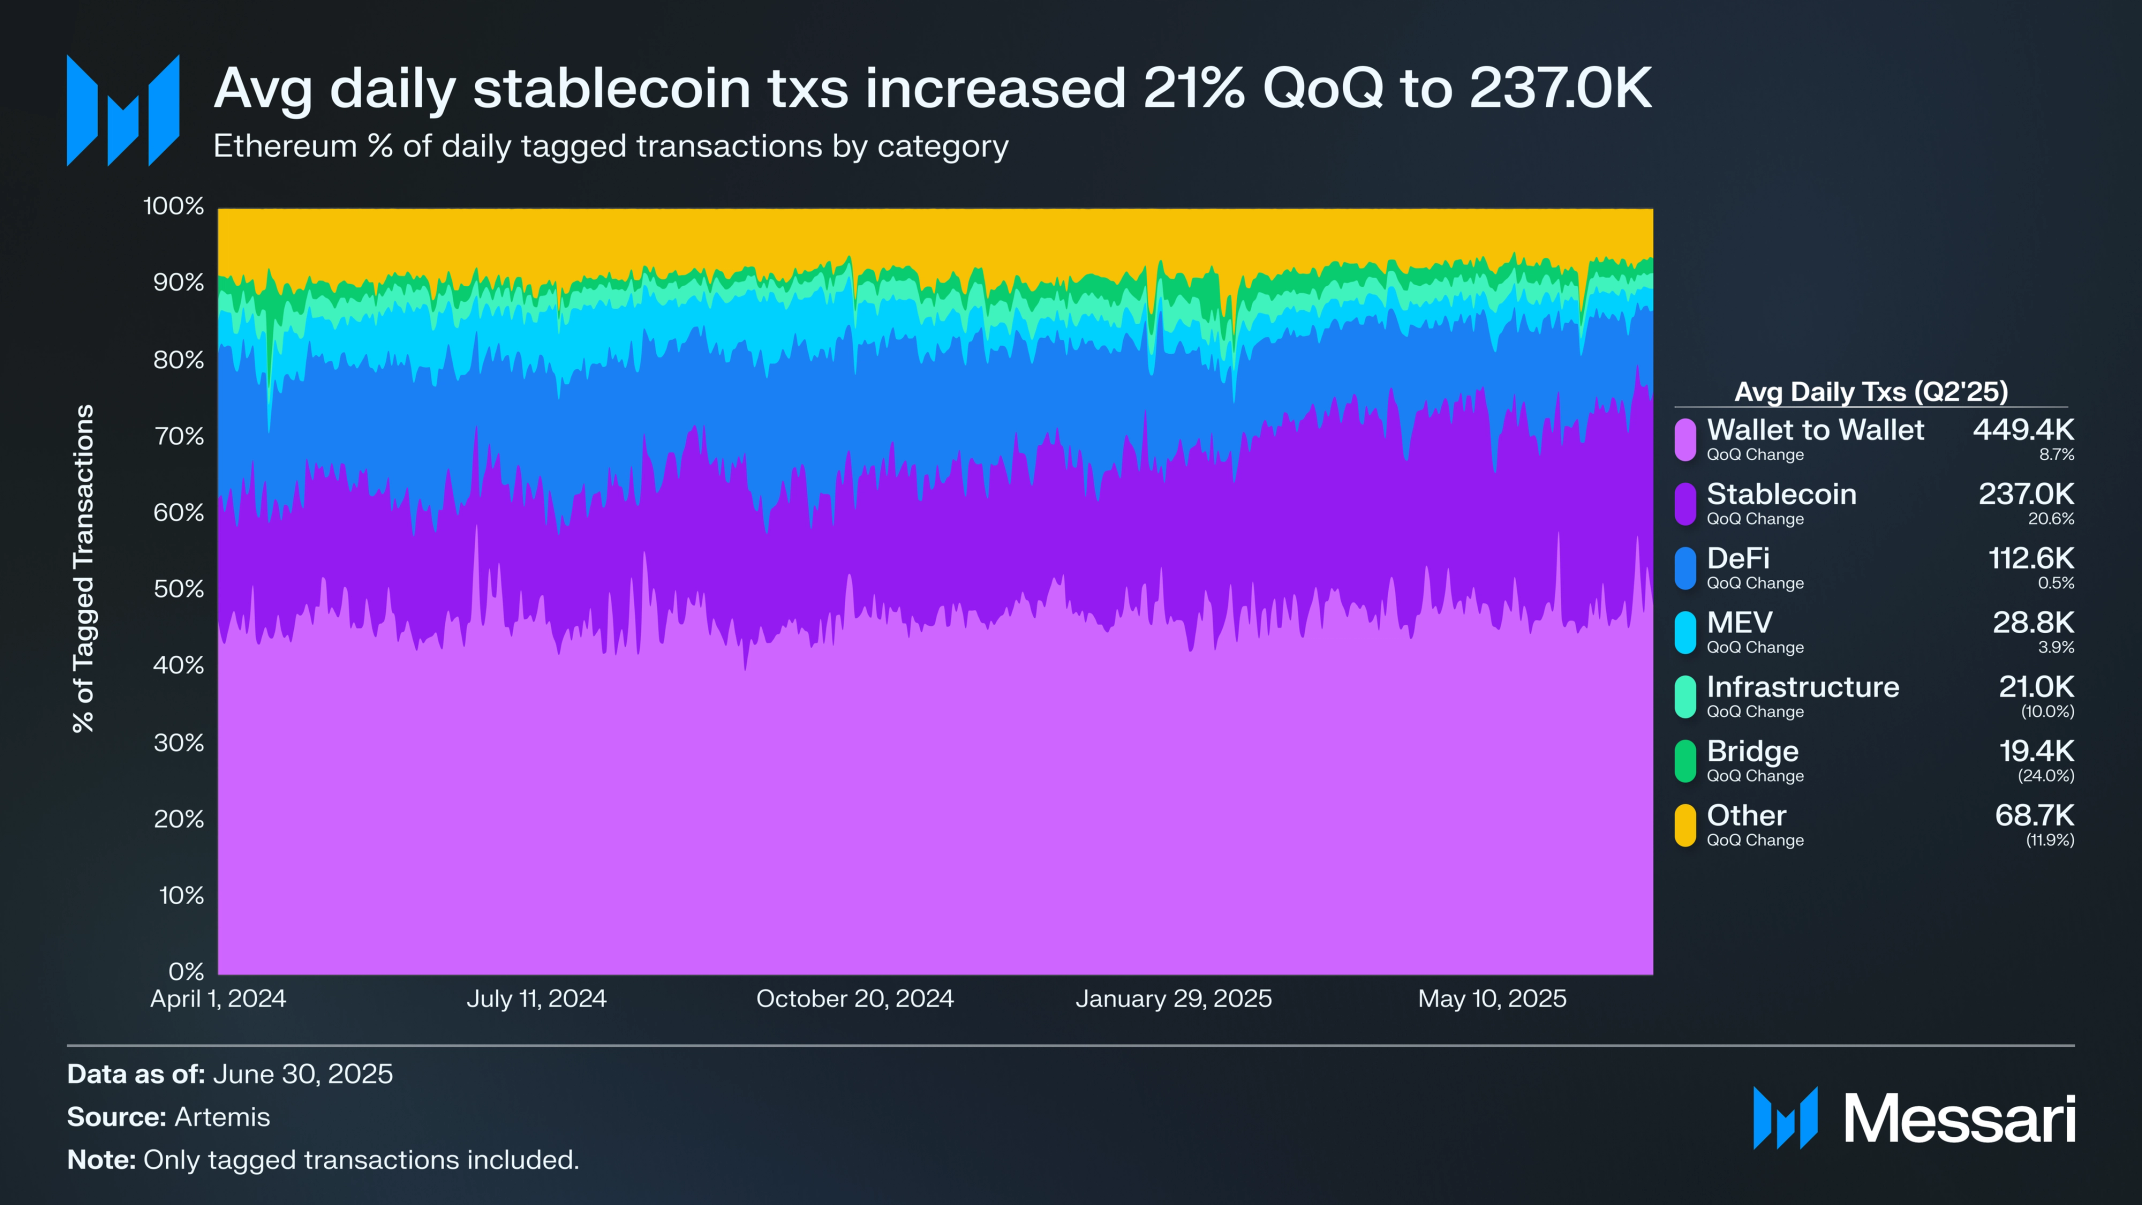
The majority of transactions in Q2 were driven by two categories: wallet-to-wallet and stablecoins. Wallet-to-wallet transactions have historically been the predominant driver of transaction activity on Ethereum, and Q2 was no exception. Daily average transactions for this category increased 9% QoQ to 449,400, and accounted for 48% of all tagged transactions in Q2. Stablecoin transactions recorded the biggest increase QoQ, with the daily average up 21% to 237,000 (25% of tagged transactions). Combined, wallet-to-wallet and stablecoin transactions accounted for 73% of all tagged transactions in Q2 (up 5% QoQ from 70%). On the other hand, daily average transactions related to DeFi (up 1% QoQ to 112,600) and MEV (up 4% QoQ to 28,800) remained relatively flat.
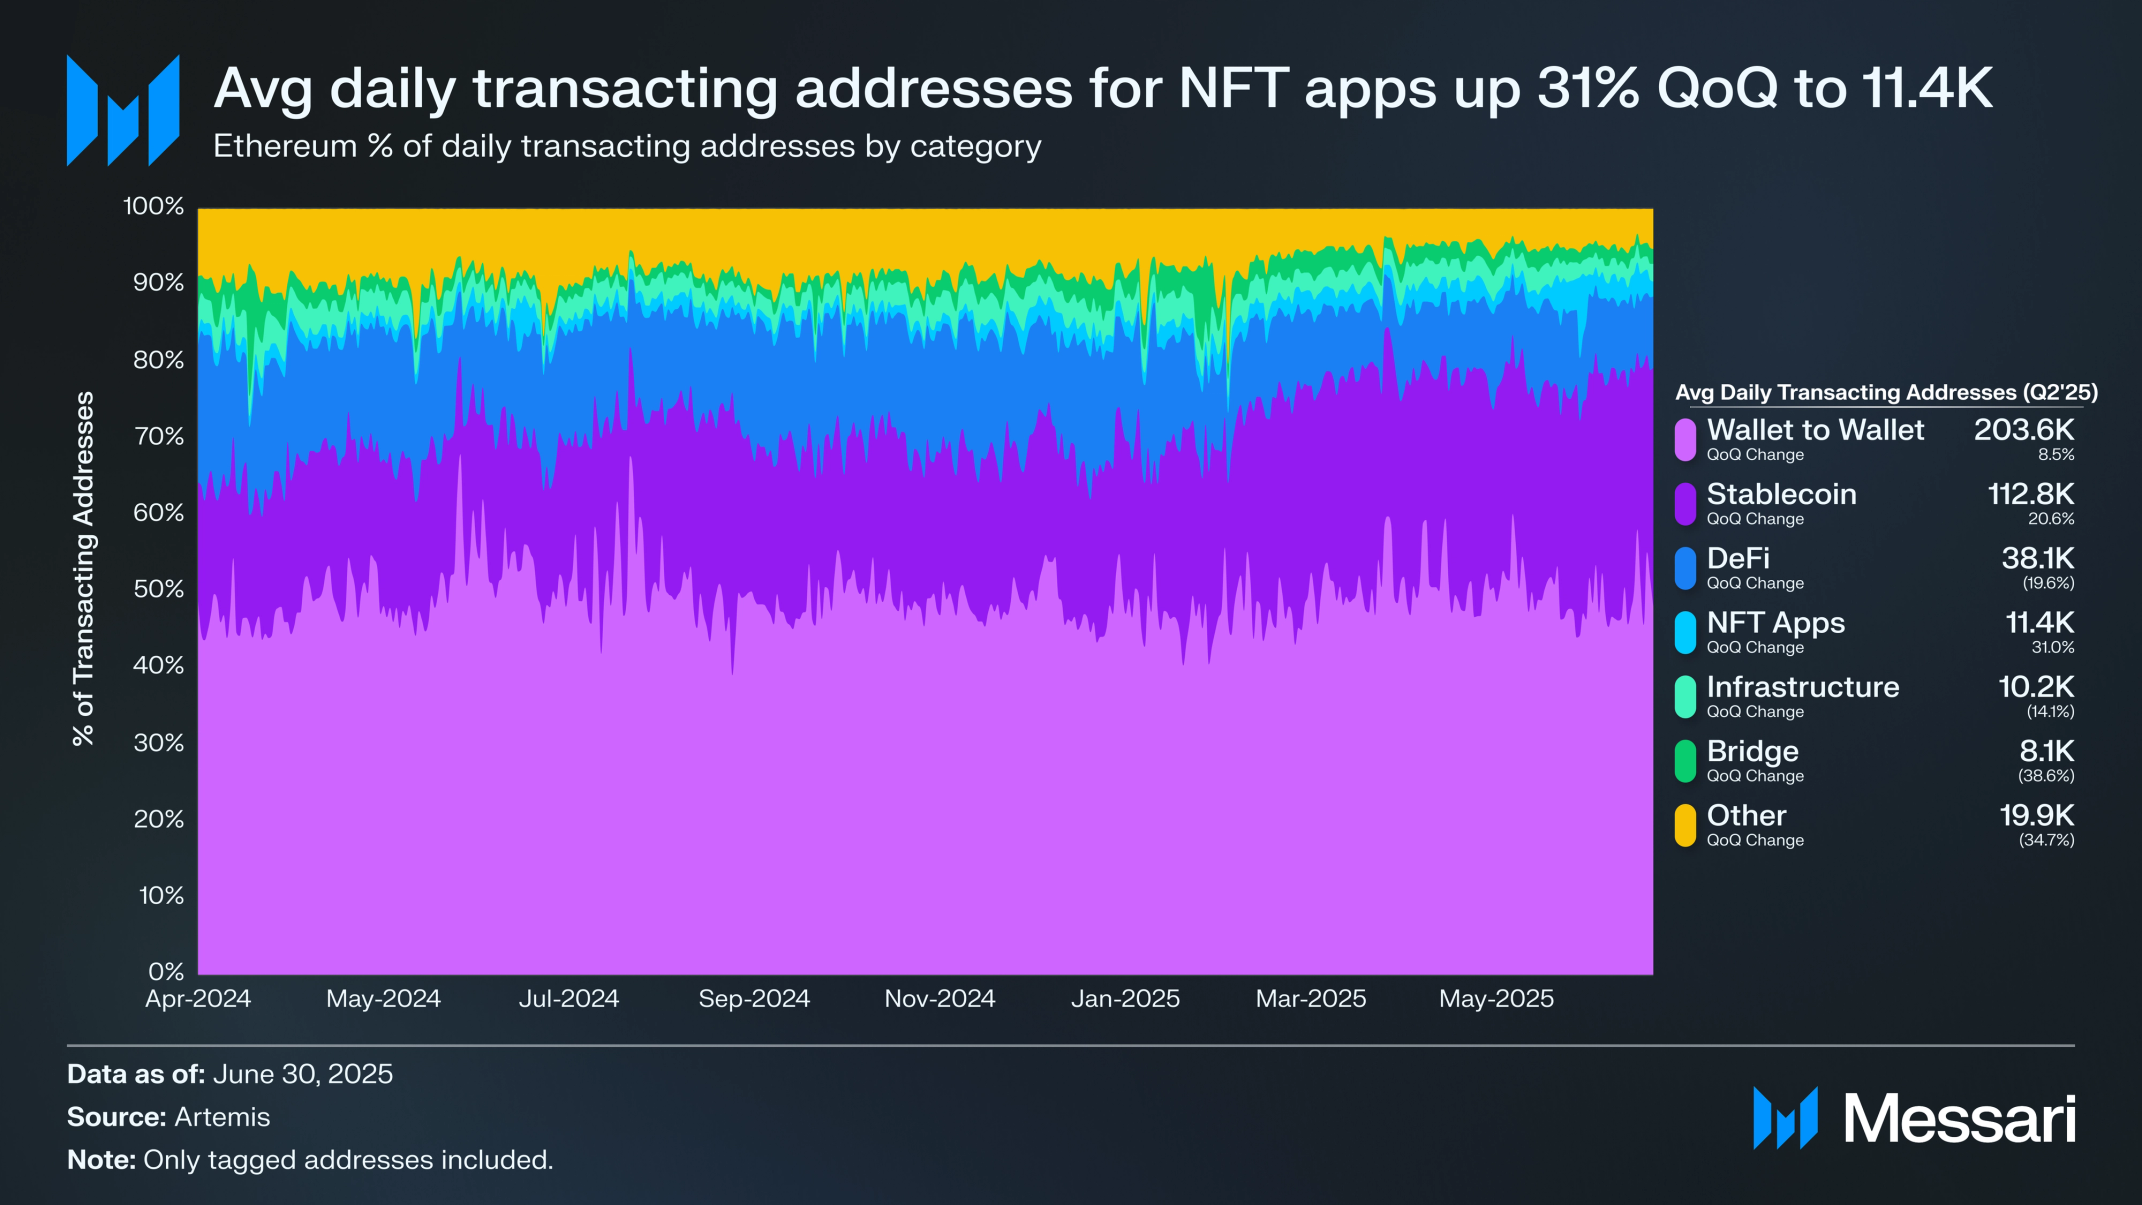
Broken down by category, daily transacting addresses underwent similar trends to transactions. Wallet-to-wallet (up 9% QoQ to 203,600 daily average transacting addresses) and stablecoins (up 21% QoQ to 112,800 daily average transacting addresses) accounted for the majority of transacting addresses in Q2, while DeFi’s (down 20% QoQ to 38,100 daily average active addresses) active addresses declined in Q2. Notably, active addresses related to NFTs increased in daily average transacting addresses, up 31% QoQ to 11,400. This increase can potentially be attributed to an increase in activity on OpenSea, which confirmed an upcoming token launch in February.
Staking
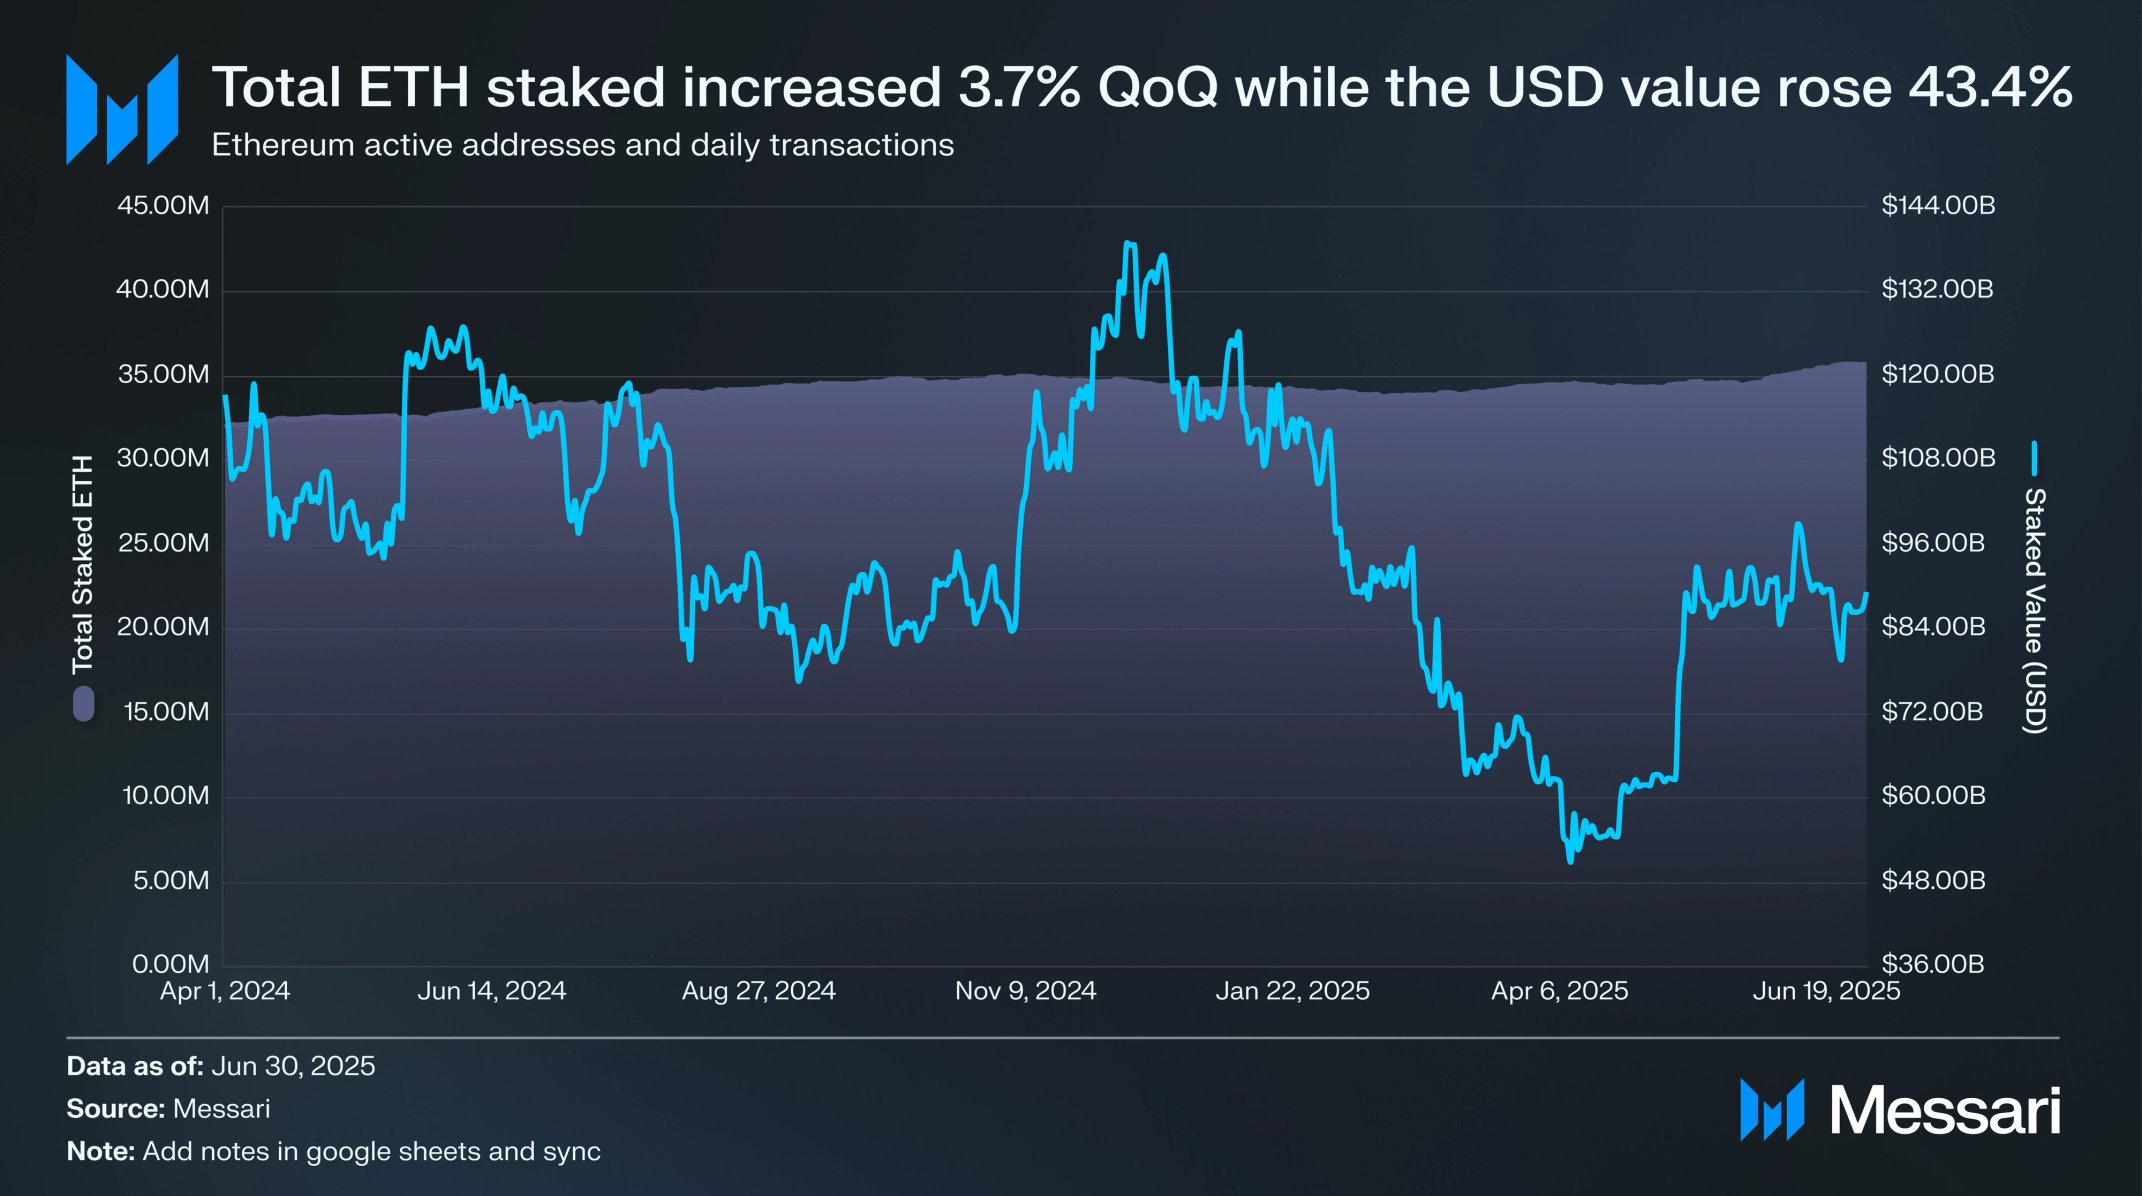
Ethereum staking activity accelerated in Q2’25. Total staked ETH increased 4% QoQ, rising from 34.4 million ETH at the end of March to 35.7 million ETH by June 30. This brought the staking ratio to 29.6%, up from 28.5% in Q1.
In USD terms, the rebound was even more pronounced. As ETH’s price recovered throughout the quarter, the USD value of staked ETH surged 43%, from $62.24 billion to $89.25 billion. This marks a strong reversal from Q1, when dollar-denominated stake value dropped 45% due to market conditions. Lastly, at the end of Q2, Ethereum validators were earning an estimated APR of 3.0%.
Ethereum remains the most valuable PoS network by total staked value. Institutional attention also continued to build, with speculation increasing around the potential for ETH staking to be integrated into ETF products, pending SEC regulatory clarity. This narrative could serve as a key catalyst for additional staking flows in the second half of 2025. For a deep dive on this subject, check out Messari’s report on staked ETH ETFs.
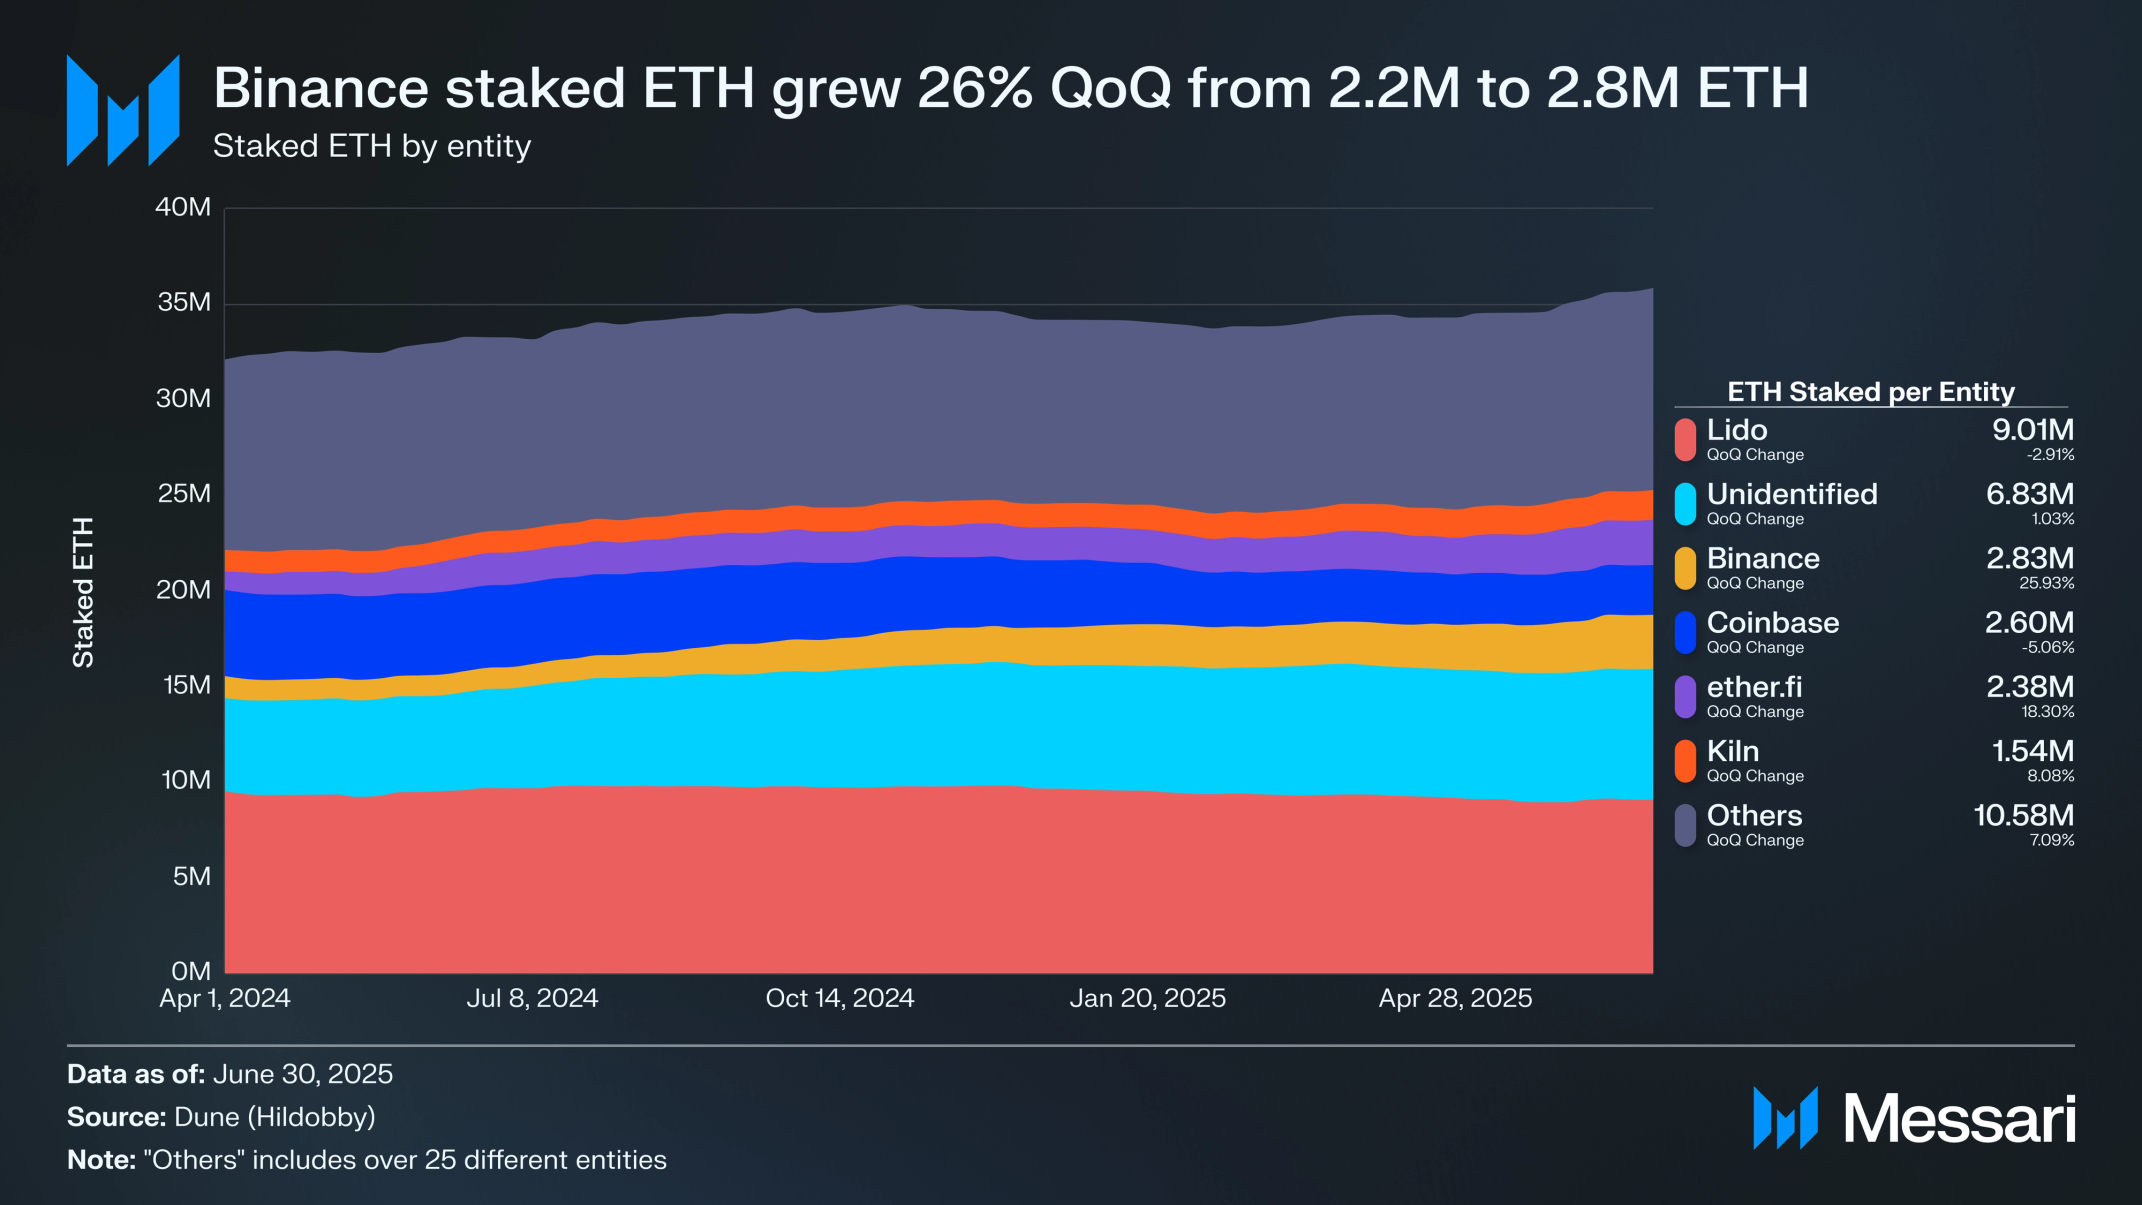
Staked ETH remained well-distributed across entities in Q2 2025, with no single operator controlling more than one-third of total staked ETH. Lido continued to lead all staking entities with 9.0 million ETH, though this represented a 3% QoQ decrease. Unidentified staking operators followed with 6.8 million ETH, suggesting continued participation by independent validators and non-custodial solutions. Binance gained the largest absolute increase among major entities, ending the quarter with 2.8 million ETH staked, up 26% QoQ.
Coinbase’s decline persisted into Q2, with its staked ETH falling 5% QoQ to 2.6 million, as competitors continued to gain traction. Ether.fi surpassed 2.4 million ETH staked, up 18% QoQ, continuing its growth trend as a leading liquid restaking platform. Kiln also increased its staked ETH to 1.6 million, up 8% QoQ. Overall, the top six entities accounted for approximately 93% of all staked ETH, with the long tail of “Others” rising 7% to 10.6 million ETH by quarter end.
Ecosystem Overview
Layer-2
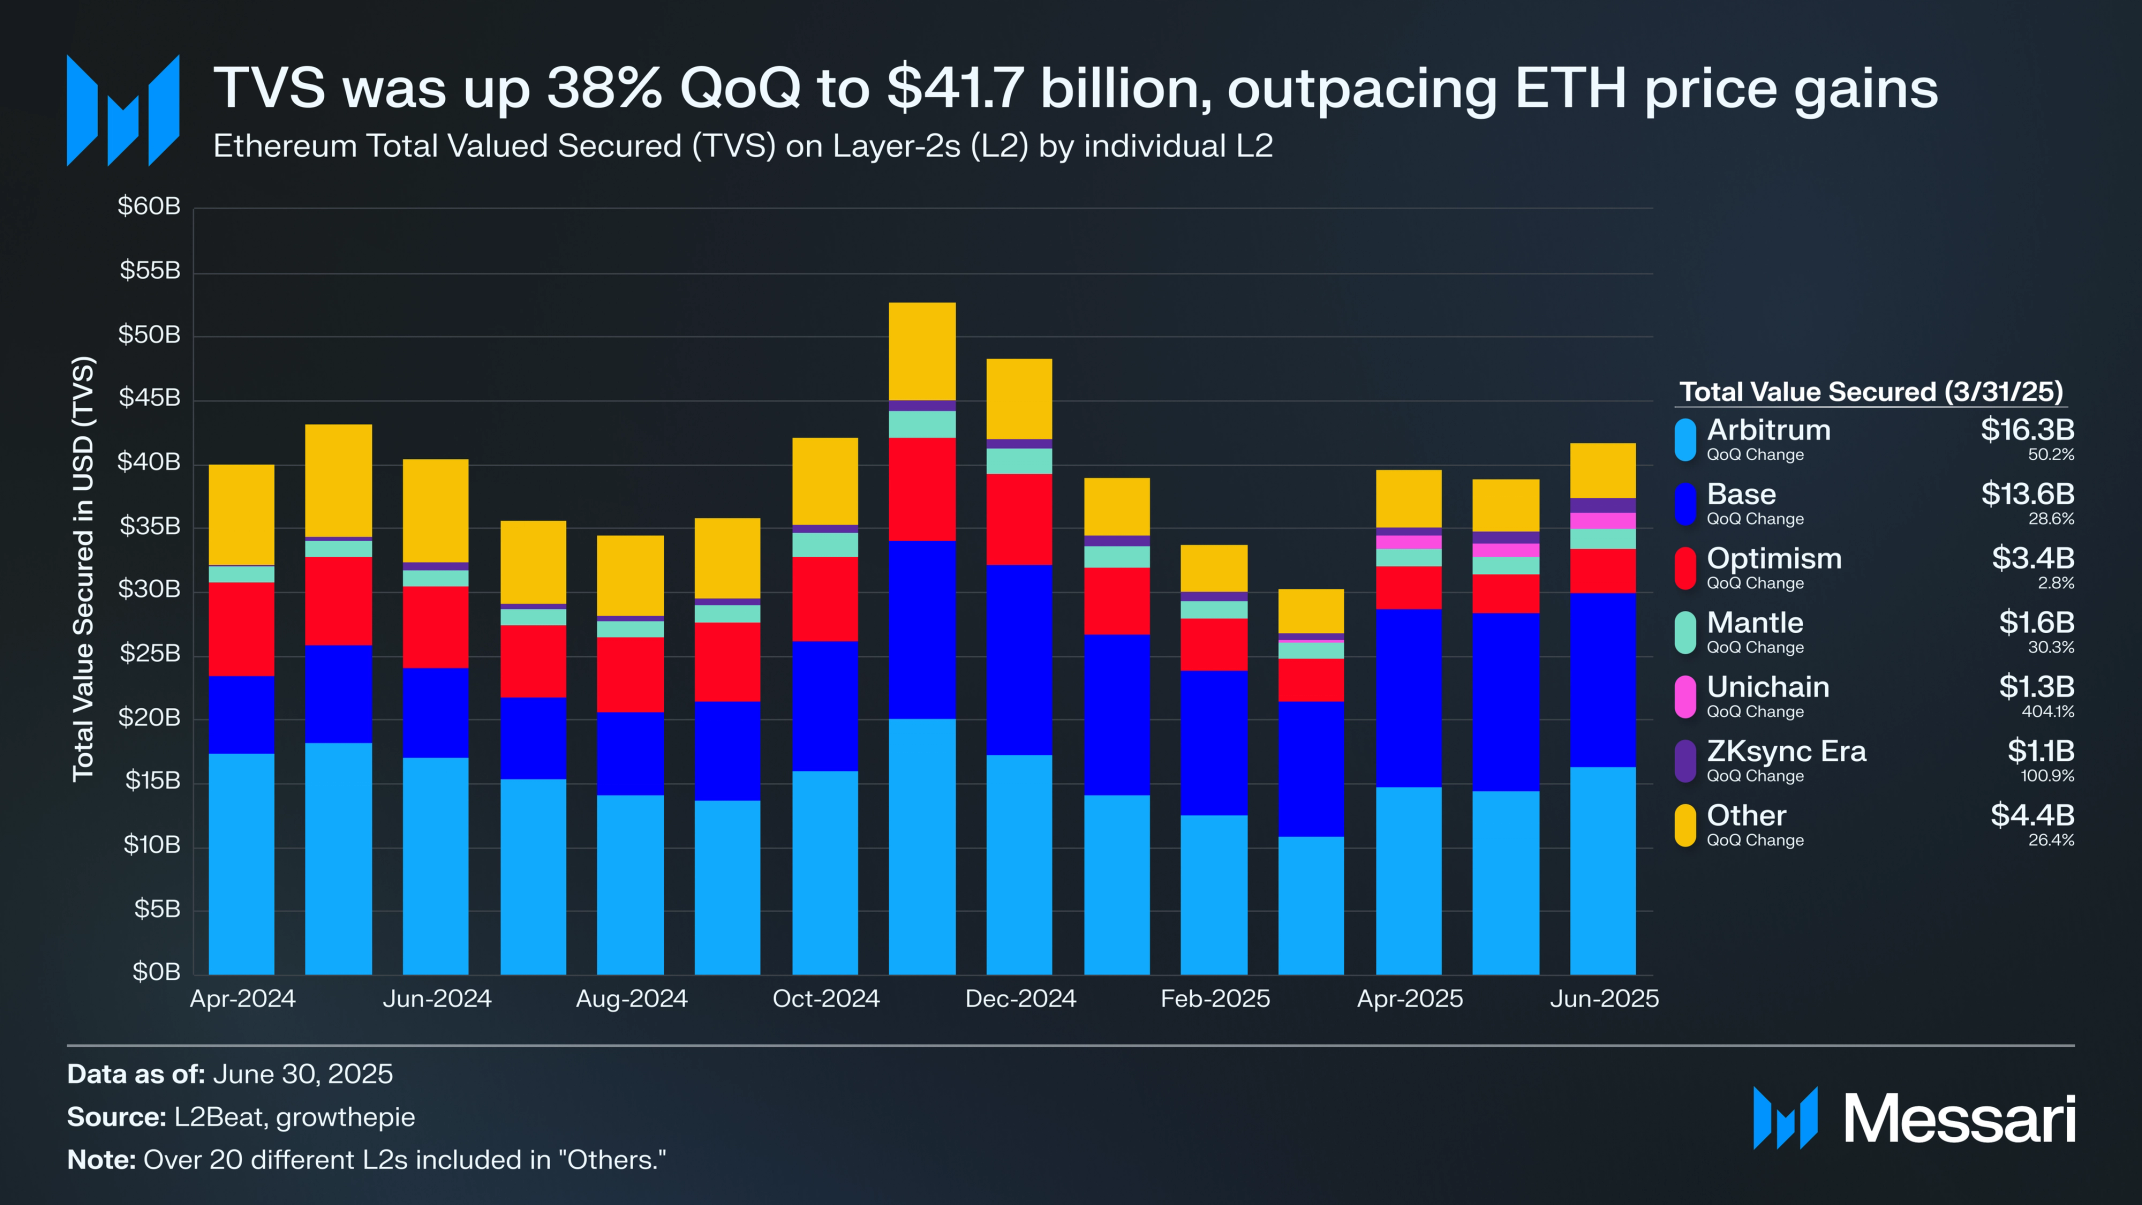
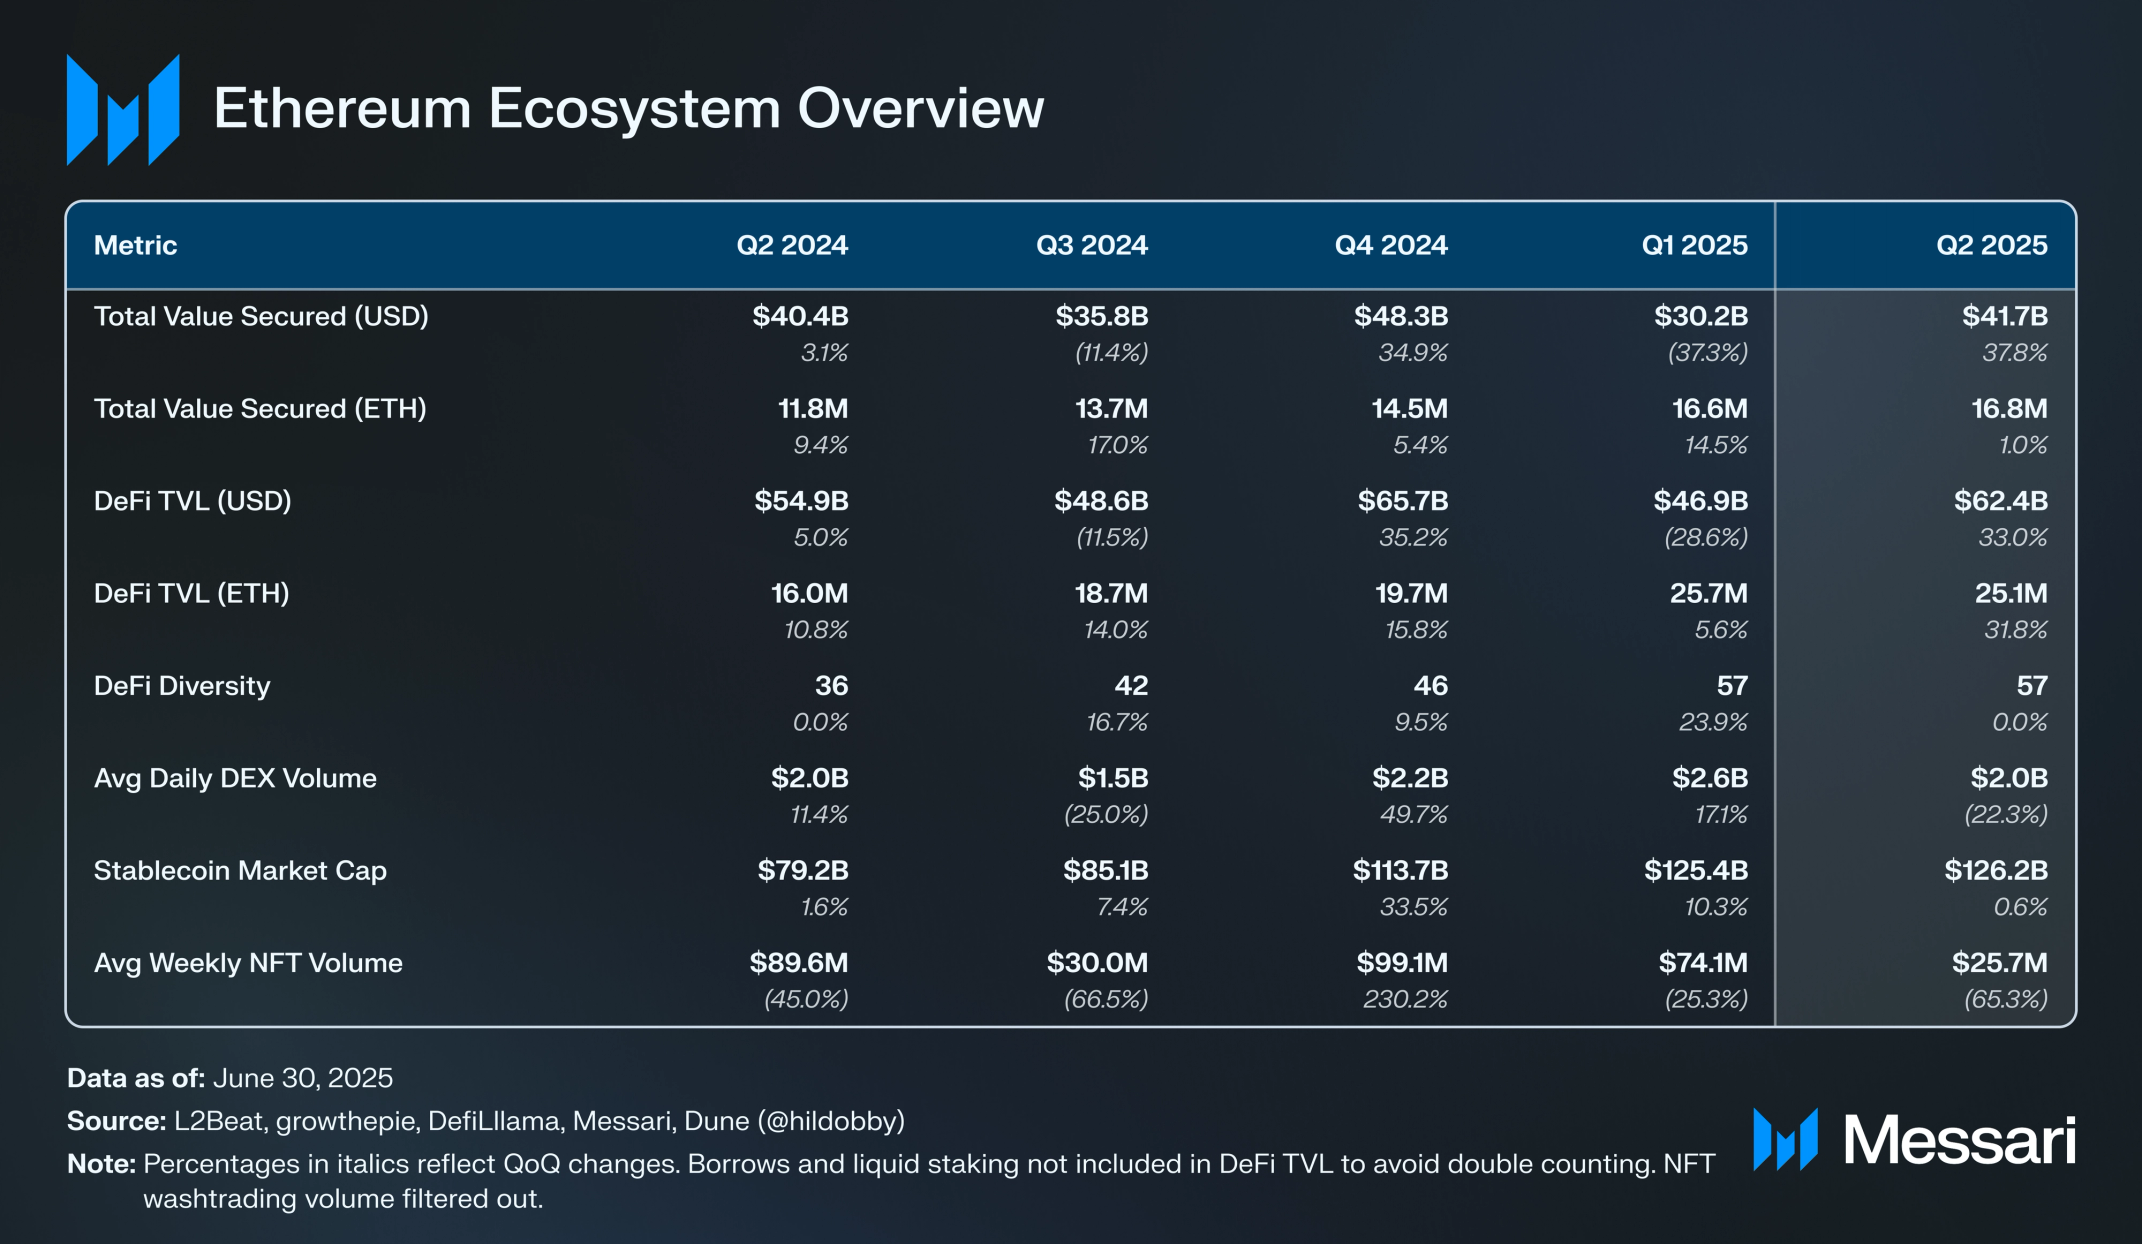
Total Value Secured (TVS) measures the sum of all assets on Ethereum L2s. The competition for TVS among L2s remains intense, with new entrants emerging each quarter and mercenary capital moving from chain to chain. The majority of TVS has gravitated towards two L2s: Arbitrum and Base. Base has been steadily gaining ground on Arbitrum over the past few quarters, but was outpaced in Q2. However, both L2s ended up with an increase in TVS due to increases in crypto prices and capital inflow. Arbitrum’s TVS increased 50% QoQ to $16.28 billion, representing 39% of all TVS, while Base’s TVS increased slightly less at 29% QoQ to $13.64 billion, representing 33% of all TVS. Combined, the two accounted for 72% of TVS, up 1% QoQ. The L2 with the biggest Q2 increase in TVS was Unichain. Unichain’s TVS increased 404% QoQ from $252.8 million to $1.27 billion, making it the 4th largest L2 by TVS. Unichain’s TVS has been bolstered by an extensive incentive campaign, which allocated $21 million in UNI tokens to liquidity providers and users on Unichain. Lastly, no L2 within the top 6 had a QoQ decrease in TVS.
DeFi
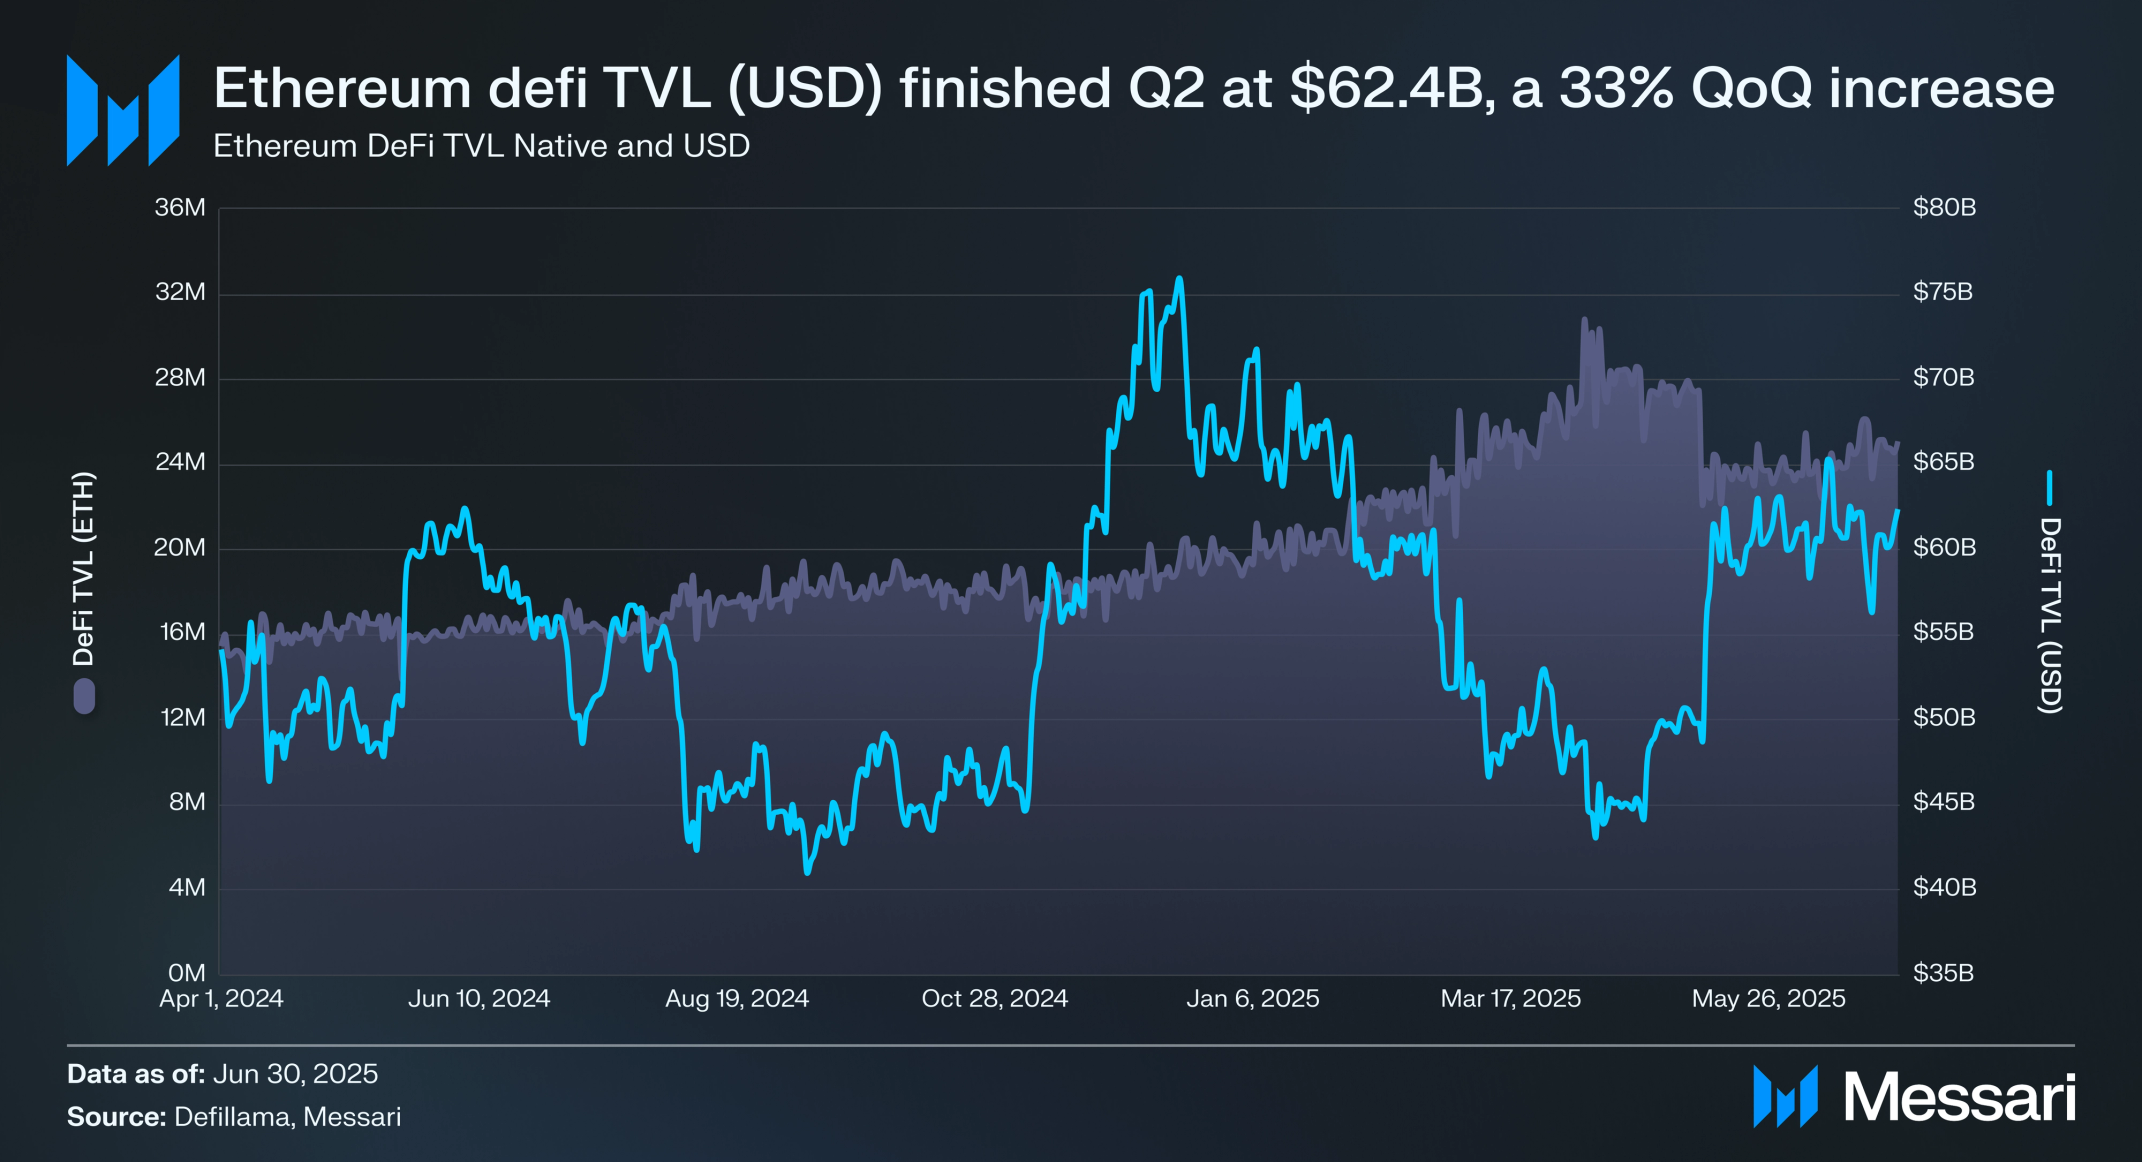
Ethereum DeFi TVL rebounded in Q2’25, with total value locked in USD terms rising from $46.9 billion to $62.4 billion, a 33% QoQ increase that recovered much of the Q1 drawdown. Ethereum maintained its lead as the dominant DeFi chain by TVL, growing from 52% of all TVL to 56% by the end of Q2. In ETH terms, DeFi TVL retracted slightly from 25.7 million to 25.1 million ETH, a 3% decrease.
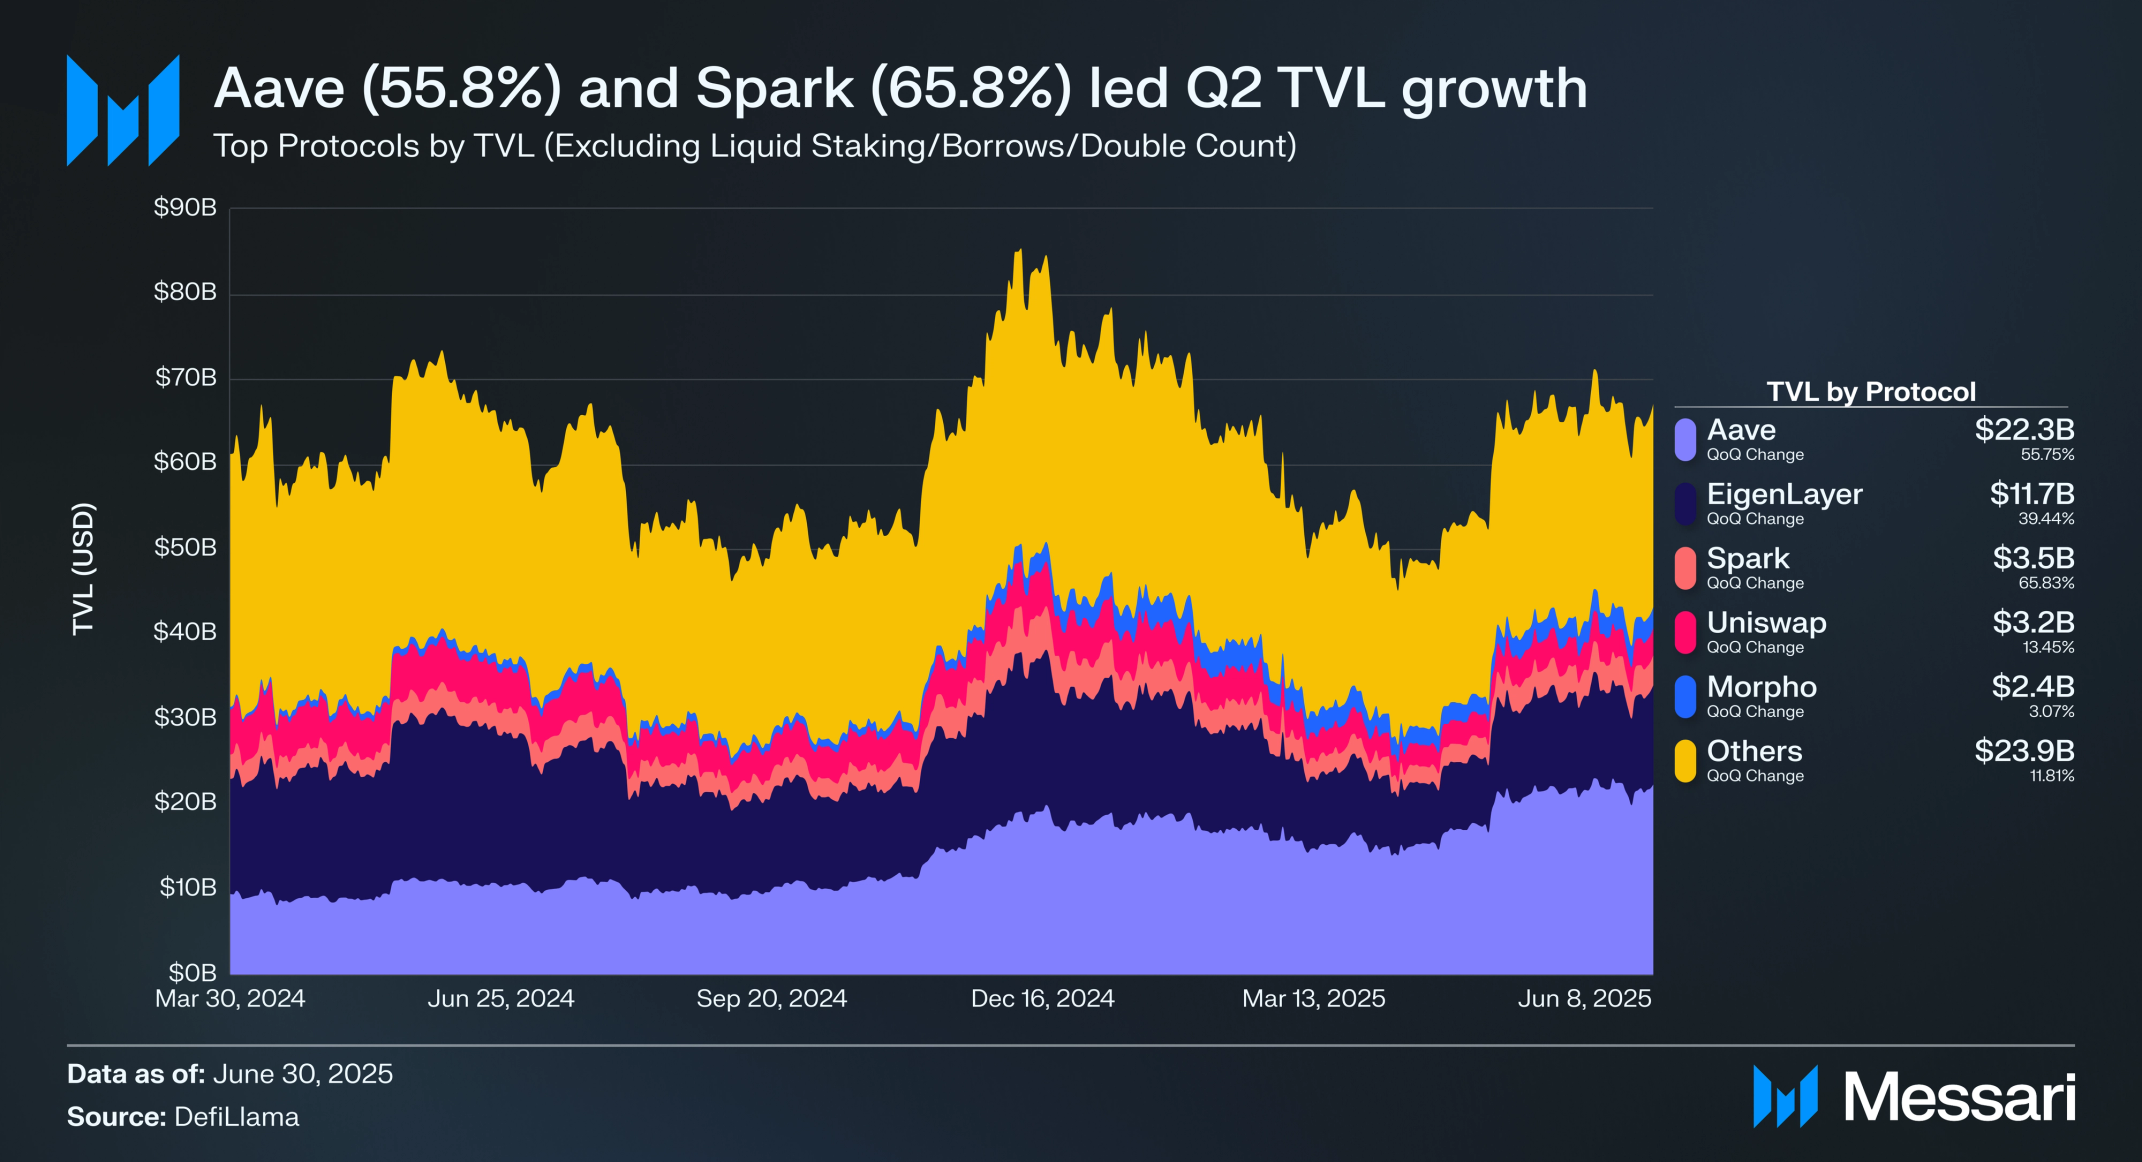
Ethereum’s leading DeFi protocols posted strong recoveries in Q2’25 as market conditions improved. Aave continued to dominate in protocol TVL, growing 56% QoQ from $14.3 billion to $22.3 billion. Aave’s growth is not only impressive due to it already being the largest DeFi protocol by TVL, but also shows an increased demand for lending and borrowing as market conditions grow more favorable. Spark also grew significantly over Q2, from $2.1 billion to $3.5 billion, a 66% QoQ increase. EigenLayer picked up the bronze medal in growth for Q2, increasing in TVL by 39% QoQ from $8.4 billion to $11.7 billion. The largest protocols by TVL grew the most in percent terms in Q2, demonstrating the moat that existing large dApps have and the trust that comes with being a well-established player.
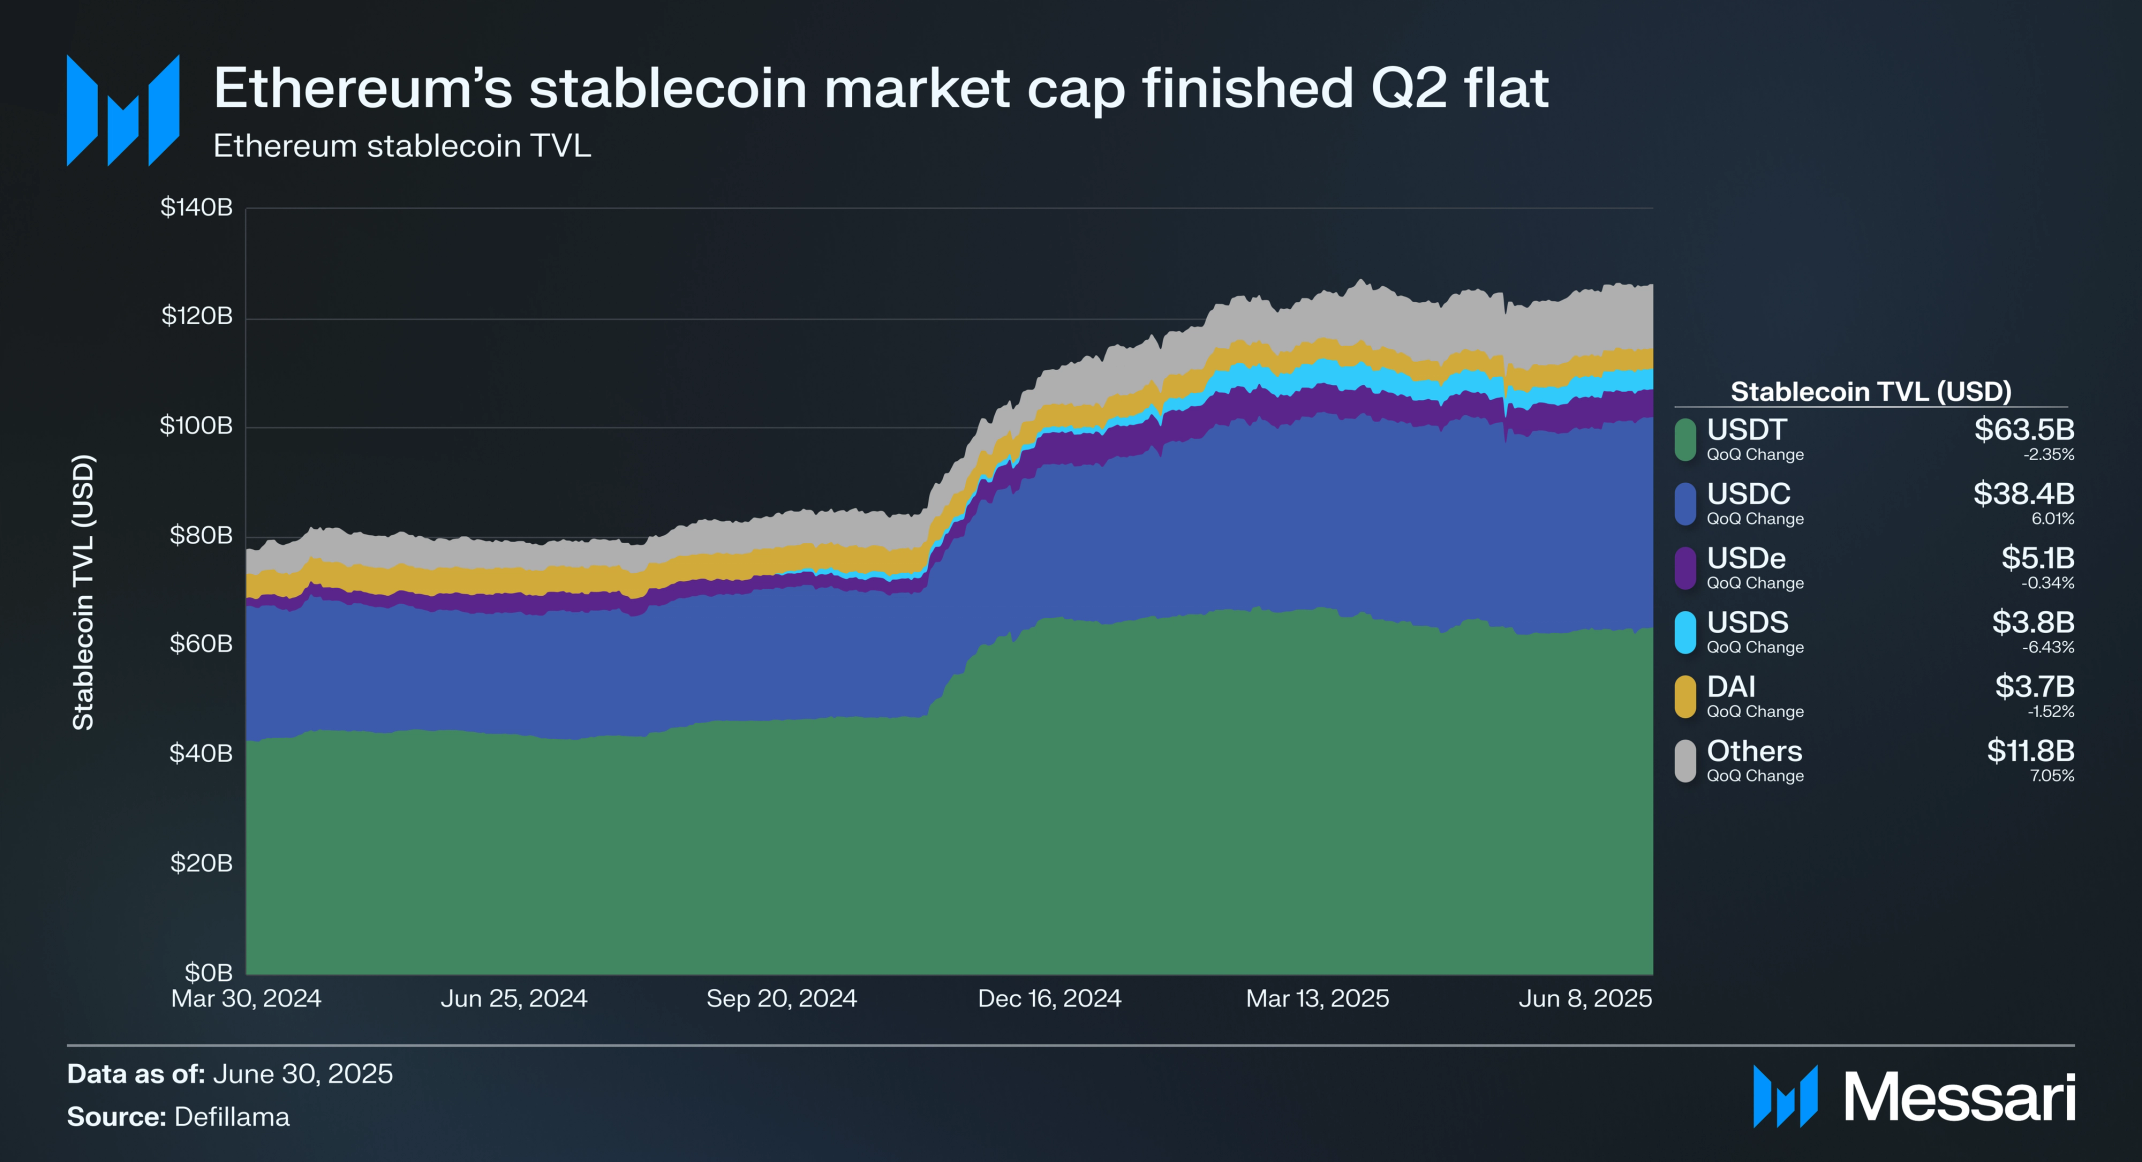
Stablecoin growth on Ethereum slowed in Q2’25 but remained positive, with total market cap rising 1% QoQ, from $125.13 billion at the end of March to $126.23 billion by June 30. This marked the seventh consecutive quarter of growth for Ethereum-based stablecoins.
USDT, still the largest stablecoin by supply, declined 2% QoQ, from $64.99 billion to $63.47 billion, reducing its share of Ethereum stablecoins to 50%. Meanwhile, USDC increased 6%, growing from $36.26 billion to $38.44 billion, and now accounts for 31% of the total. Combined, USDT and USDC made up 81% of all stablecoins on Ethereum, roughly the same as Q1.
Other stablecoins showed mixed performance:
- USDe: down 0.3% to $5.09B
- USDS: down 6% to $3.76B
- DAI: down 2% to $3.69B
- Others: up 7% to $11.78B
The modest net increase in stablecoin supply came despite declines in most major assets, highlighting Ethereum’s resilience as the core layer for dollar-denominated liquidity and suggesting that while growth has cooled, the foundation remains strong and widely distributed.
For an in-depth analysis of stablecoin trends, check out the State of Stablecoins.
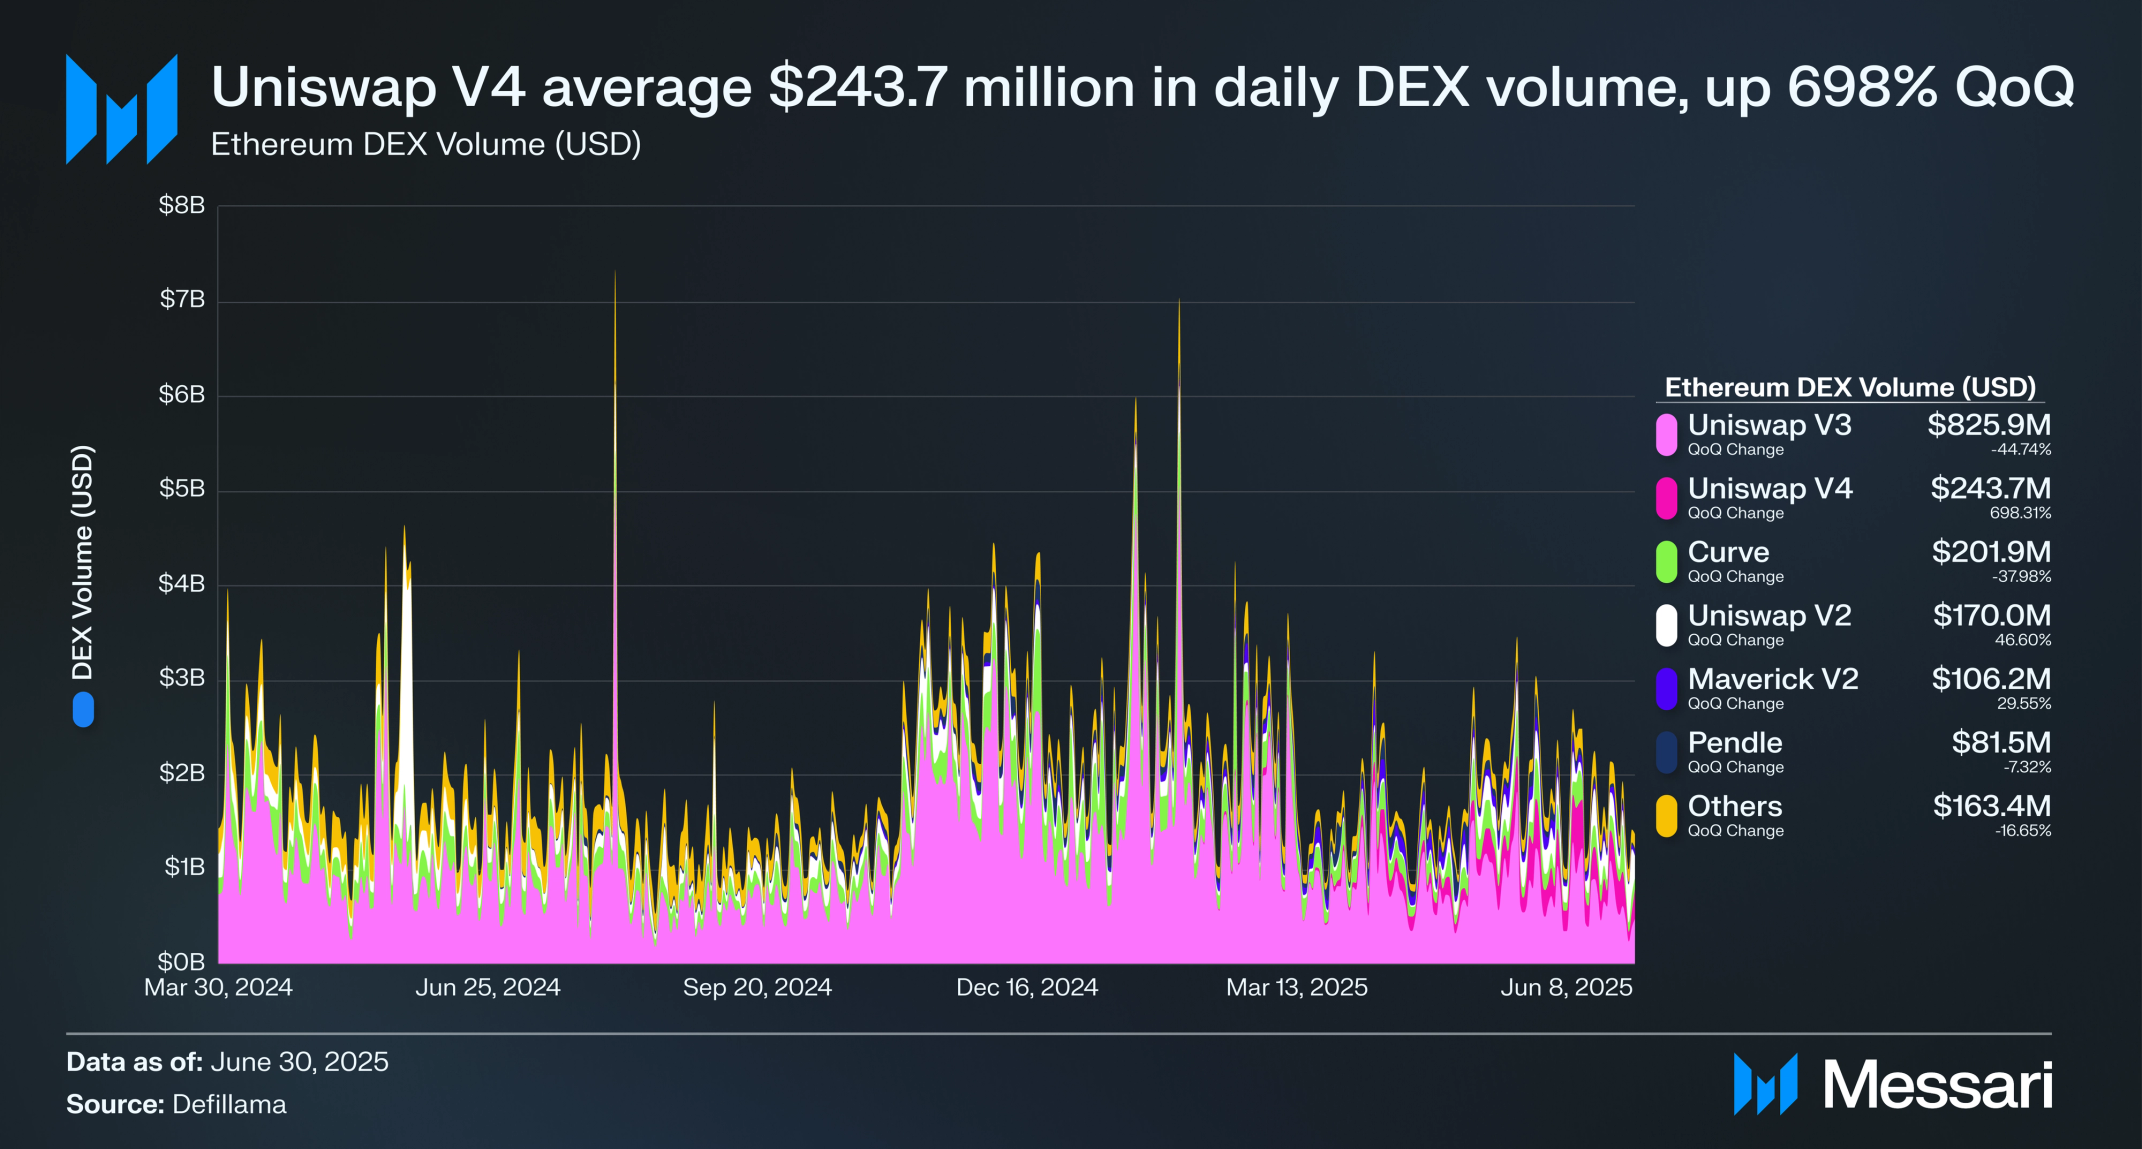
Ethereum DEX activity cooled off in Q2’25, with daily average volume falling from $2.33 billion in Q1 to $1.79 billion in Q2, a 23% decline. This drop came as market volatility eased and memecoin trading rotated to other ecosystems like Solana and Base. Despite the decline, Ethereum remained the second-largest network by DEX volume.
Uniswap V3, while still the leading DEX on Ethereum, endured a sharp pullback in activity. Daily average volume dropped 45% QoQ, from $1.49 billion to $826 million, reducing its market share from 64% to 46%. Meanwhile, Uniswap V4 made a major leap forward. Volume surged from just $30.5 million to $243.7 million, increasing its market share from 1% to 14%, as more liquidity and usage migrated to the newer version.
Curve, which had benefited from stablecoin-related activity in Q1, also declined this quarter. Volume dropped from $325.6 million to $201.9 million (–38%), and its market share fell from 14% to 11%. Uniswap V2, however, rebounded significantly: daily average volume rose 47% QoQ, from $116.0 million to $170.0 million, as renewed memecoin speculation briefly returned to Ethereum in June.
Emerging platforms like Maverick V2 and Pendle remained stable, while “Others” (a mix of smaller protocols) contributed $163.4 million in average daily volume. Collectively, these platforms showed that while volume was down overall, Ethereum’s DEX ecosystem continues to fragment and evolve, with Uniswap V4 in particular showing early signs of traction.
NFTs
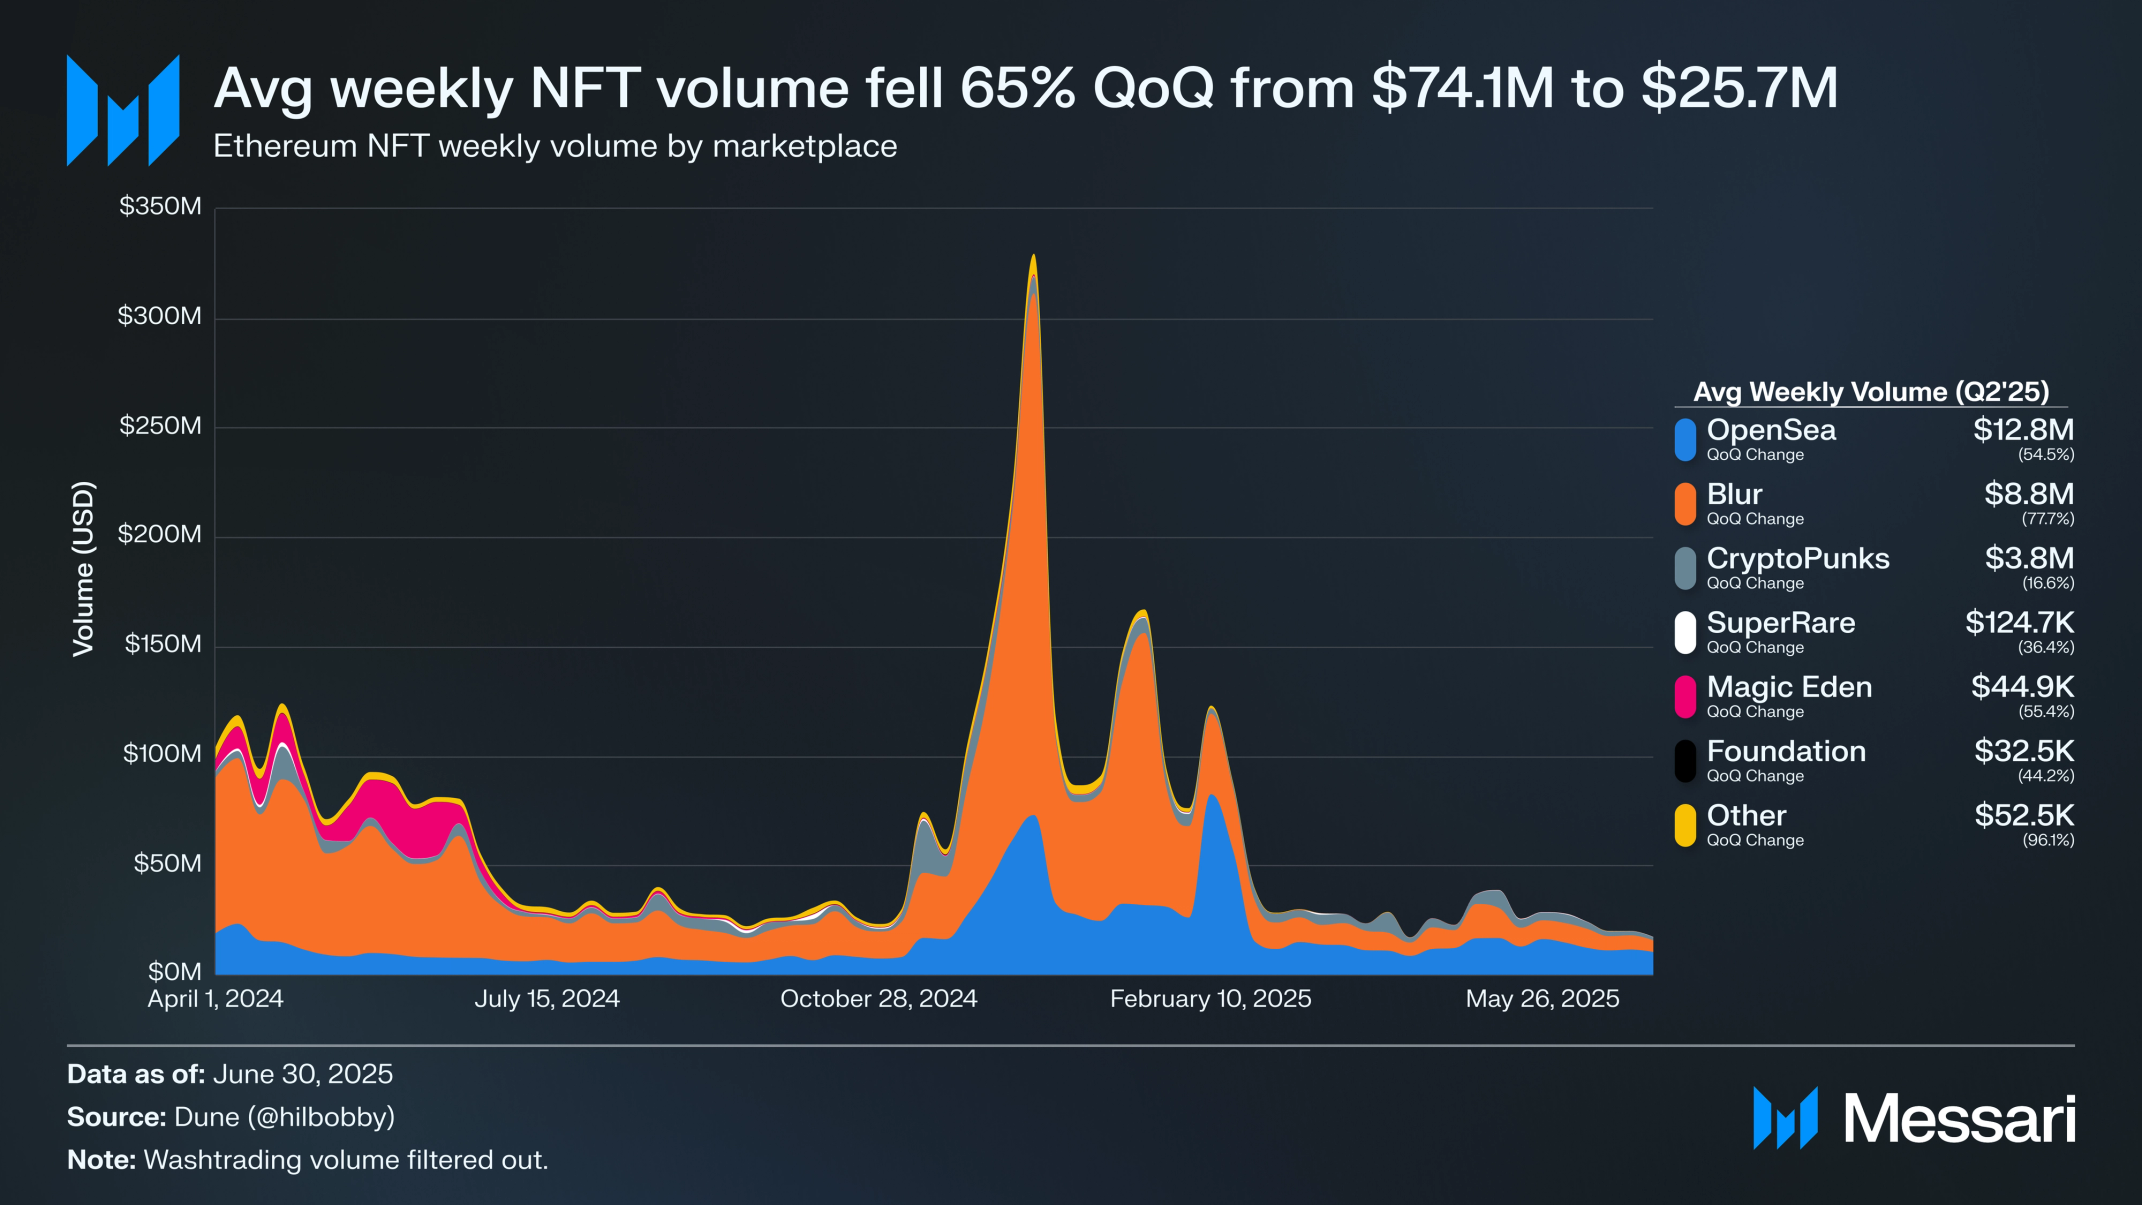
NFT volumes reached new multi-year lows in Q2. With the hype from token launches from NFT projects like Pudgy Penguins and Remilia dying down, weekly average NFT volume fell 65% QoQ from $74.1 million to $25.7 million.
Most NFT exchanges’ volume declined as a result. However, OpenSea overtook Blur for the top NFT exchange in Q2 after it confirmed an upcoming token launch in February 2025. The announcement led users to shift volumes to the platform in hopes of an airdrop. Weekly average volumes on OpenSea decreased 55% QoQ to $12.8 million, while Blur’s volumes fell 78% QoQ to $8.8 million. The two NFT exchanges accounted for 84% of NFT volume on Ethereum this quarter.
Ethereum Foundation Updates
Leadership Changes and Protocol Rebranding
In Q2, the Ethereum Foundation (EF) formalized a leadership transition with the appointment of two Co-Executive Directors, Hsiao-Wei Wang and Tomasz K. Stańczak, marking a new phase of coordinated strategic oversight. The dual leadership model is designed to enhance EF’s ability to operate in a complex, rapidly evolving environment, balancing long-term vision with near-term execution.
Additionally, Ethereum’s Protocol Research and Development (R&D) team underwent a major organizational shift, rebranding as simply “Protocol” and restructuring to align directly with three top-level strategic priorities: scaling Ethereum L1, scaling data availability via blobs, and improving user experience (UX). This shift marks a formal operational pivot toward execution-focused collaboration, clearer accountability, and tighter coordination across Ethereum’s core development efforts.
The Protocol group identified the need to reorient around impact-driven goals to meet the demands of a maturing ecosystem. Each strategic track now has dedicated leadership: Tim Beiko and Ansgar Dietrichs for L1 scaling, Alex Stokes and Francesco D’Amato for L2 scaling and blobs, and Barnabé Monnot and Josh Rudolf for UX. Dankrad Feist will support as a strategic advisor across all initiatives.
Alongside this focus, Protocol has streamlined its internal structure to enable faster transitions from research to production, increased technical rigor, and more efficient feedback loops across teams. Some EF members have exited the organization as part of the restructuring, though the Foundation noted it encourages continued contributions from those individuals within the broader Ethereum ecosystem.
Protocol’s updated structure is also intended to foster deeper engagement with the community and other core development teams. Future work will include reconfiguring Ethereum’s governance forums to improve signal collection and decision-making. The team also announced open roles for a UX Lead and a Performance Engineering Lead to help address user-facing bottlenecks and performance challenges.
This organizational evolution is designed to accelerate Ethereum’s ability to deliver protocol-level innovation at scale while remaining aligned with the network’s foundational values.
Treasury Policy Updates
In Q2, the Ethereum Foundation published its first formal treasury policy, setting a structured framework for managing capital in support of the network’s long-term health, resilience, and values. The policy establishes targets for operating reserves, strategic spending, asset allocation, and transparency, reflecting a more institutionalized approach to Ethereum’s financial stewardship as the ecosystem matures.
The EF will maintain a 2.5-year operating runway and limit annual operating expenses to 15% of the total treasury, with a plan to gradually reduce this to 5% over five years. ETH sales will be calibrated based on reserve needs and market conditions, ensuring both liquidity and minimal market impact. Fiat holdings will be split across real-time operating capital, liability-matched reserves, and tokenized real-world assets, while crypto assets will continue to be deployed through staking, lending, and select DeFi protocols.
The policy also reinforces Ethereum’s cypherpunk ethos, introducing a “Defipunk” evaluation framework to guide protocol engagement and capital deployment. This framework emphasizes privacy, permissionlessness, self-custody, open-source development, and minimal reliance on centralized infrastructure. All future onchain deployments by EF will be assessed against these criteria, with a commitment to supporting protocols that advance security, autonomy, and user protections.
To increase transparency, EF will release quarterly and annual reports detailing performance, risk posture, and material changes. Internally, the Foundation is working to strengthen its own operational security, privacy practices, and technical rigor, with the aim of setting industry standards for principled treasury management. The policy reflects EF’s dual mandate: to responsibly manage its assets and to lead by example in cultivating an open, secure, and sovereign financial ecosystem on Ethereum.
Ethereum Pectra Upgrade
On May 7, 2025, Ethereum implemented the Pectra upgrade, its most comprehensive update since The Merge. The upgrade bundled 11 EIPs focused on usability, validator efficiency, rollup scalability, and long-term EVM improvements.
Key changes included EIP-7702, which introduced a new account abstraction model for externally owned accounts (EOAs). This upgrade allows EOAs to function like smart accounts, enabling features such as transaction batching, fee sponsorship, and custom validation logic. EIP-7251 raised the maximum validator stake limit from 32 ETH to 2,048 ETH, reducing validator set bloat while improving efficiency for large operators.
On the scalability front, Pectra doubled blob capacity from six to twelve per block, directly expanding throughput for rollups that rely on blobs for data posting. PeerDAS (Peer Data Availability Sampling) was also introduced, improving data availability verification and advancing Ethereum toward full Danksharding. Finally, EIP-3540 marked the first implementation of the EVM Object Format (EOF), restructuring contract storage for greater safety and enabling future upgrades.
Pectra strengthens Ethereum’s foundation by improving UX through smart accounts, scaling rollup data capacity, and modernizing the EVM. Rather than a radical shift, it represents incremental but decisive progress toward Ethereum’s modular, rollup-centric future.
Closing Summary
Ethereum closed Q2 2025 in a position of cautious recovery and structural advancement. Market conditions improved following a steep Q1 drawdown, with ETH regaining value and ETF inflows signaling institutional demand. The emergence of Ethereum treasury strategies by public companies further underscored ETH’s evolving role as a balance sheet asset. Onchain activity showed modest signs of growth, with wallet-to-wallet and stablecoin usage driving transaction volumes, while fees continued their secular decline as execution shifted to L2s.
Staking expanded both in absolute and dollar terms, reinforcing Ethereum’s dominance as the largest proof-of-stake network and highlighting growing institutional interest in staked ETH as a financial product. At the same time, the L2 landscape consolidated around Arbitrum and Base, while new entrants like Unichain demonstrated that incentives continue to shape liquidity flows. DeFi rebounded strongly in USD terms, stablecoins maintained steady growth, and NFTs reached cyclical lows, with activity concentrated around expectations of an OpenSea token launch.
At the protocol level, the Pectra upgrade delivered meaningful improvements in account abstraction, validator efficiency, and rollup scalability, advancing Ethereum’s rollup-centric roadmap. Organizational changes within the Ethereum Foundation and the formalization of its treasury policy marked a shift toward more structured governance and financial stewardship, aligning operations with the network’s long-term priorities.
Taken together, these developments reflect Ethereum’s ongoing transition from experimental infrastructure to an institutional-grade settlement layer. While challenges remain in fee sustainability, competitive pressure from alternative L1s, and user migration to L2s, Ethereum continues to reinforce its position as the central hub for DeFi, stablecoins, and modular scaling. The trajectory into the second half of 2025 will depend on how effectively Ethereum converts its technical upgrades, institutional inflows, and growing L2 ecosystem into renewed end-user demand.
Let us know what you loved about the report, what may be missing, or share any other feedback by filling out this short form. All responses are subject to our Privacy Policy and Terms of Service.

Drexel is a Research Manager at Messari for the Protocol Reporting team with a focus on base layers and DeFi. He is a strong follower of the crypto mullet thesis of diligence in the front and degen in the back.

AJC is a Research Manager at Messari for the Enterprise team. His primary focuses are on Bitcoin and Consumer. Prior to joining Messari, AJC wrote an independent crypto blog.
Mentioned Assets