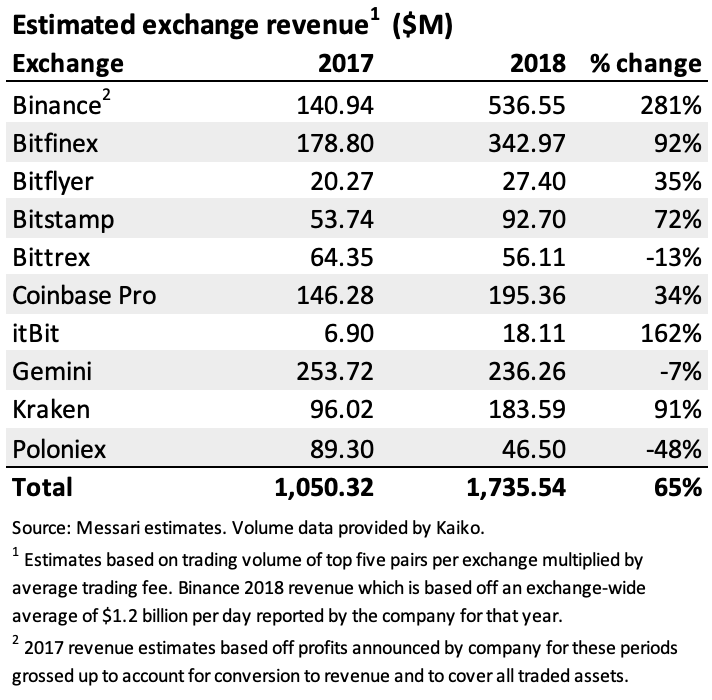
Real 10 crypto exchanges revenue

During the bull run in 2017, cryptoasset prices soared and irrational exuberance was rampant. The now infamous NYT article “Everyone is Getting Hilariously Rich and You’re Not” proved to mark a cyclical top. People were “investing” without regard for fundamentals or valuation frameworks into projects with little to no development. And many speculators did strike it rich. Some 2017 tokens produced eye-popping, slot-machine-like returns.
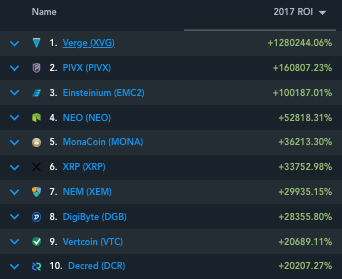
[TBI note: Verge is likely one of the best performing financial assets of all time with a 1,280,000% return in 2017.]
Still, it was the exchanges who were really printing money as they morphed into bona fide casinos. The bottom started to fall out in Q2 2018, and many token projects began dealing with shrinking treasuries and crypto funds were left with angry LP’s. The exchanges though, kept on humming, thanks to a higher trading volume baseline than they had seen prior to the 2017 bubble.
Exactly how much did they make?
We wanted to estimate trading revenue figures of the exchanges used in our “Real 10” methodology to give you a sense of how healthy most of these businesses still are. To compare apples to apples across exchanges, our estimates are based on the spot trading volume for the top five pairs on each exchange (which generally represent ~80%+ of volumes) and the average fees from each exchange’s pricing tiers. For Binance, where the top 5 pairs represent only ~30% of volume, we used the 2018 daily average volume reported by the company.