[Messari Research] An overview of Bitcoin's historical daily price changes

On Sunday, Bloomberg reported that oil prices spiked by 19% after 5% of the global oil supply was taken offline due to drone attacks launched on Saudi Arabian oil fields. That this price change shocked the markets is an understatement. But would a price action from Bitcoin ($BTC) be similarly shocking? Kind of.
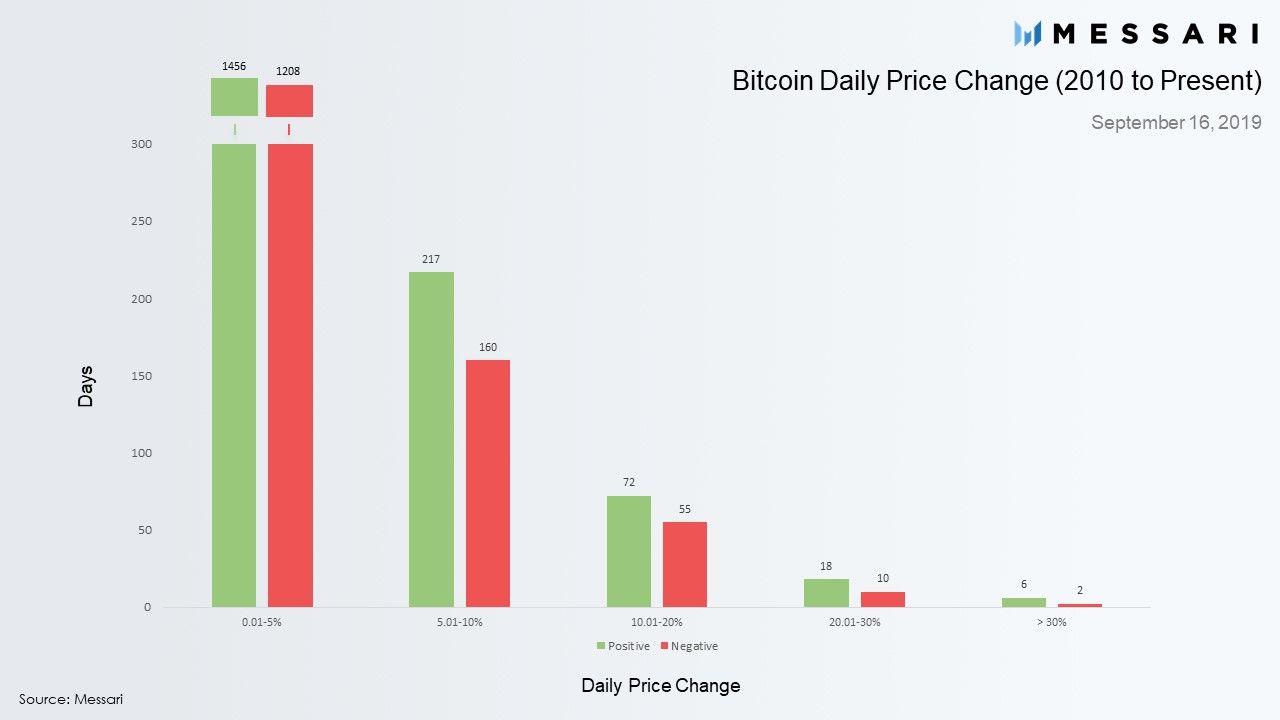
Every digital asset is notoriously volatile due to their nascence. Messari analyzed historical daily price changes for Bitcoin, however, and found that Bitcoin has climbed by 19% within a day only 3 times in its history. The above chart groups positive and negative daily price performance. The last time Bitcoin jumped by 19% was in February 2018.
Let us know what you loved about the report, what may be missing, or share any other feedback by filling out this short form. All responses are subject to our Privacy Policy and Terms of Service.
Mentioned Assets