Messari Asset Pages: The largest qualitative and quantitative information asset library on the market

Love our Asset Pages but feel they could have more bells and whistles? Drop us a note on our product feedback survey so we can continue to improve your Messari experience.
Whether digging through forums and social media noise or scouring the larger web for asset research and other meaningful metrics, filtering through dispersed information surrounding any given asset can be a daunting, time-consuming task.
That’s why our team has been hard at work to bring you our new and improved asset pages, providing you with the largest library of qualitative and quantitative information for hundreds of cryptoassets, with new pages being added weekly. With our asset pages, you no longer need to have dozens of tabs open to keep track of a given asset. We consolidate everything you need to gather informed insights on a single, clean, compact, and powerful asset page.
The pages provide users with an elevated reading and search experience that includes:
- Real-time Dashboard of all Major Asset Information: Our new “Overview” screen provides you with a real-time full-screen dashboard, merging all quantitative and qualitative information about an asset all on one screen. Discover key metrics, charts, an ROI calculator, curated events feed, market listings, in-depth research reports, and more, all on one page.
- Tabs Providing Deep Dive Aggregation of Qualitative Details: Each asset page is broken into dedicated tabs, allowing you to dig even deeper. Our asset pages provide pinpointed coverage for all of your qualitative needs through tabs that offer: deep dives into tokeneconomics, supply schedules, consensus mechanisms and governance, professional-grade research reports, curated updates, third-party news, and much more.
- Tabs Providing Expansive Coverage of All Quantitative Stats: Dedicated tabs also offer live markets, quantitative coverage for hundreds of metrics including historical data and charts ranging from price, volume, market cap, supply, and more advanced on-chain data such as network activity, fees, and revenue.
Each section of the asset pages offers a treasure trove of insights and tools to give you an in-depth, holistic view of your favorite assets. Below we dig in further to each feature you won’t want to miss out on.
Real-time Dashboard
The “Overview” screen provides you with a real-time full-screen dashboard, allowing you to discover all quantitative and qualitative information about an asset, all on one screen.
On the overview dashboard, you get a birds-eye view of:
- Key metrics
- Market data and fundamental charts
- ROI calculator
- Curated project updates feed
- In-depth research reports
- Live markets
- Historical data
- Competition
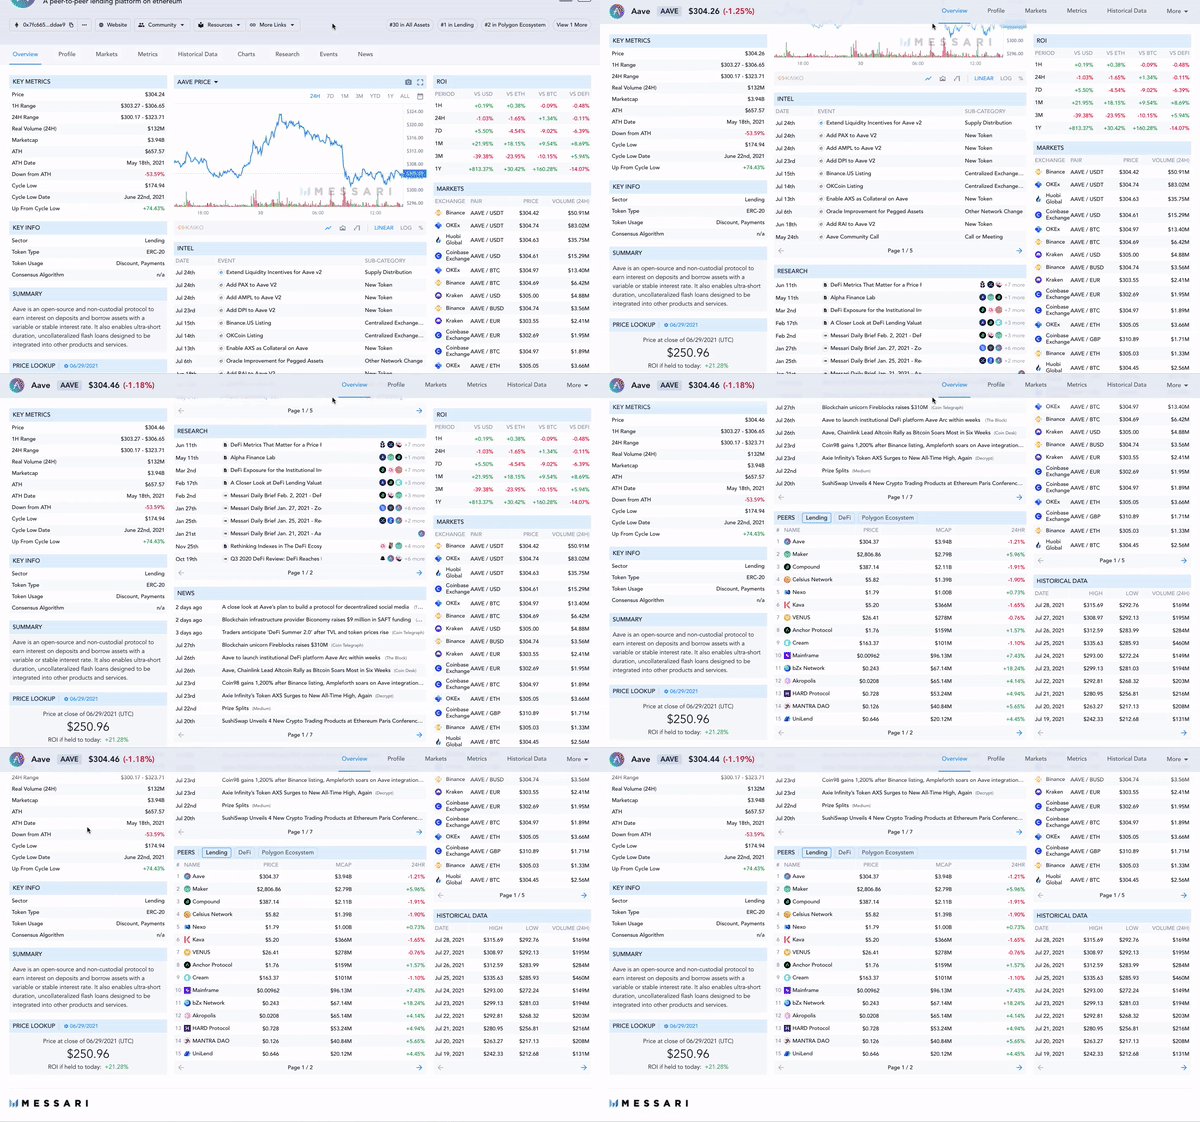
This holistic snapshot gives you everything you need to gather information quickly, without having to navigate to multiple screens. Getting an overview of an asset is great, but what if you want to dig deeper into a given qualitative and quantitative metrics? That’s where our dedicated tabs come into play, covered in the next sections.
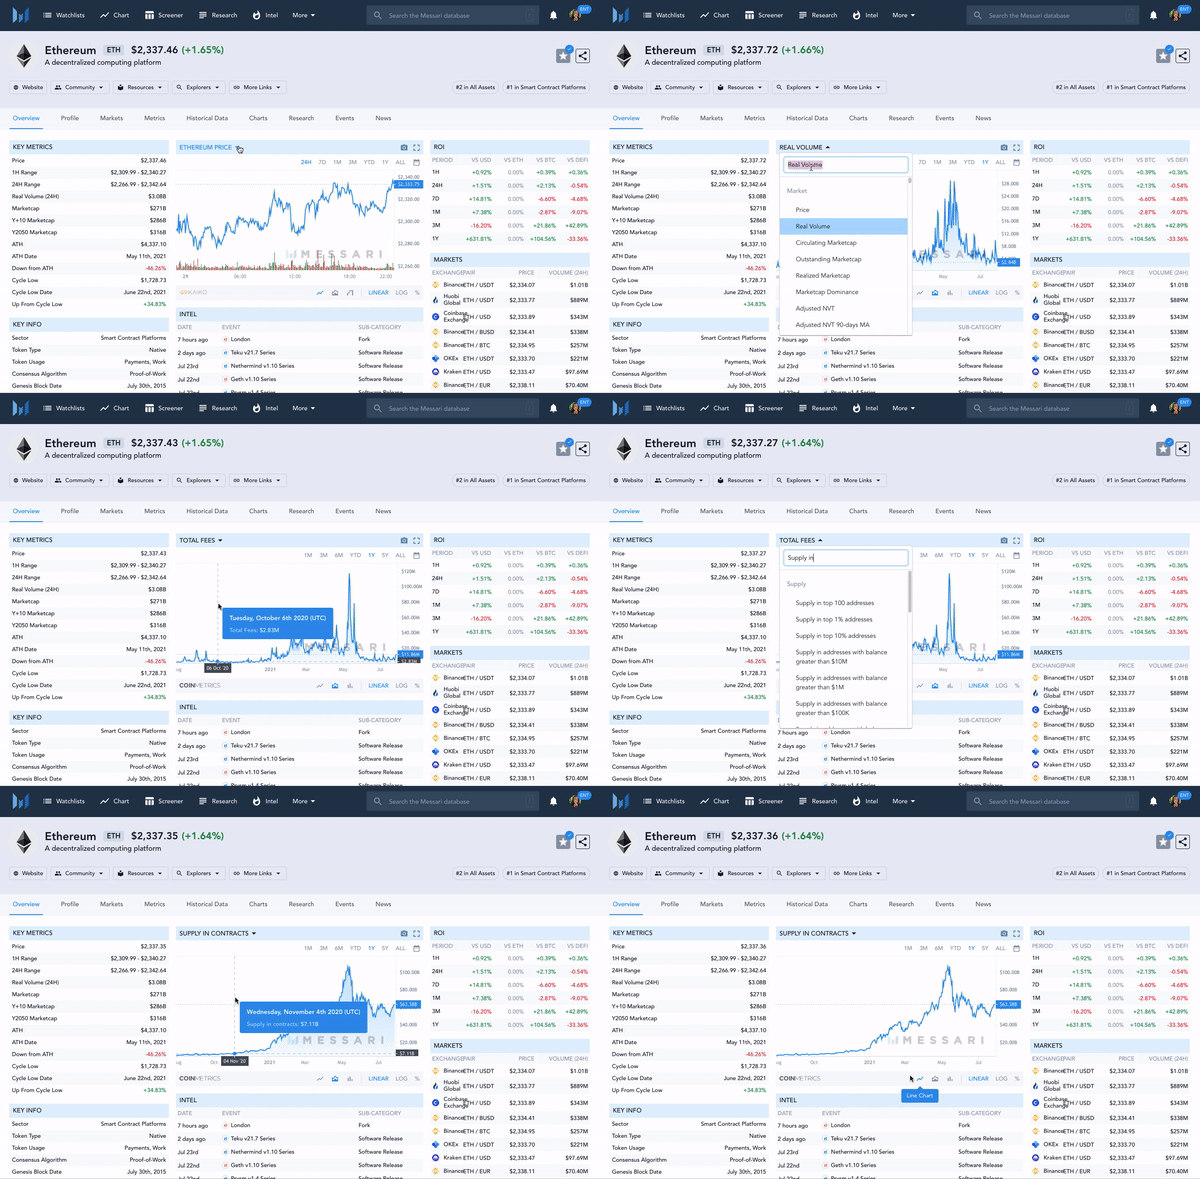
Pro Tip: Though our chart module defaults to the given asset’s “price” view, you can change the chart to hundreds of additional metric views including Real Volume, Total Fees, and Supply In Contracts simply by clicking on the drop-down arrow on the title bar.
Providing Deep Aggregation
Every good crypto professional knows DYOR can’t stop at a birds-eye view. To make the best ecosystem participation decision, you need to jump down a research rabbit hole. That’s where our dedicated asset page tabs come into place.
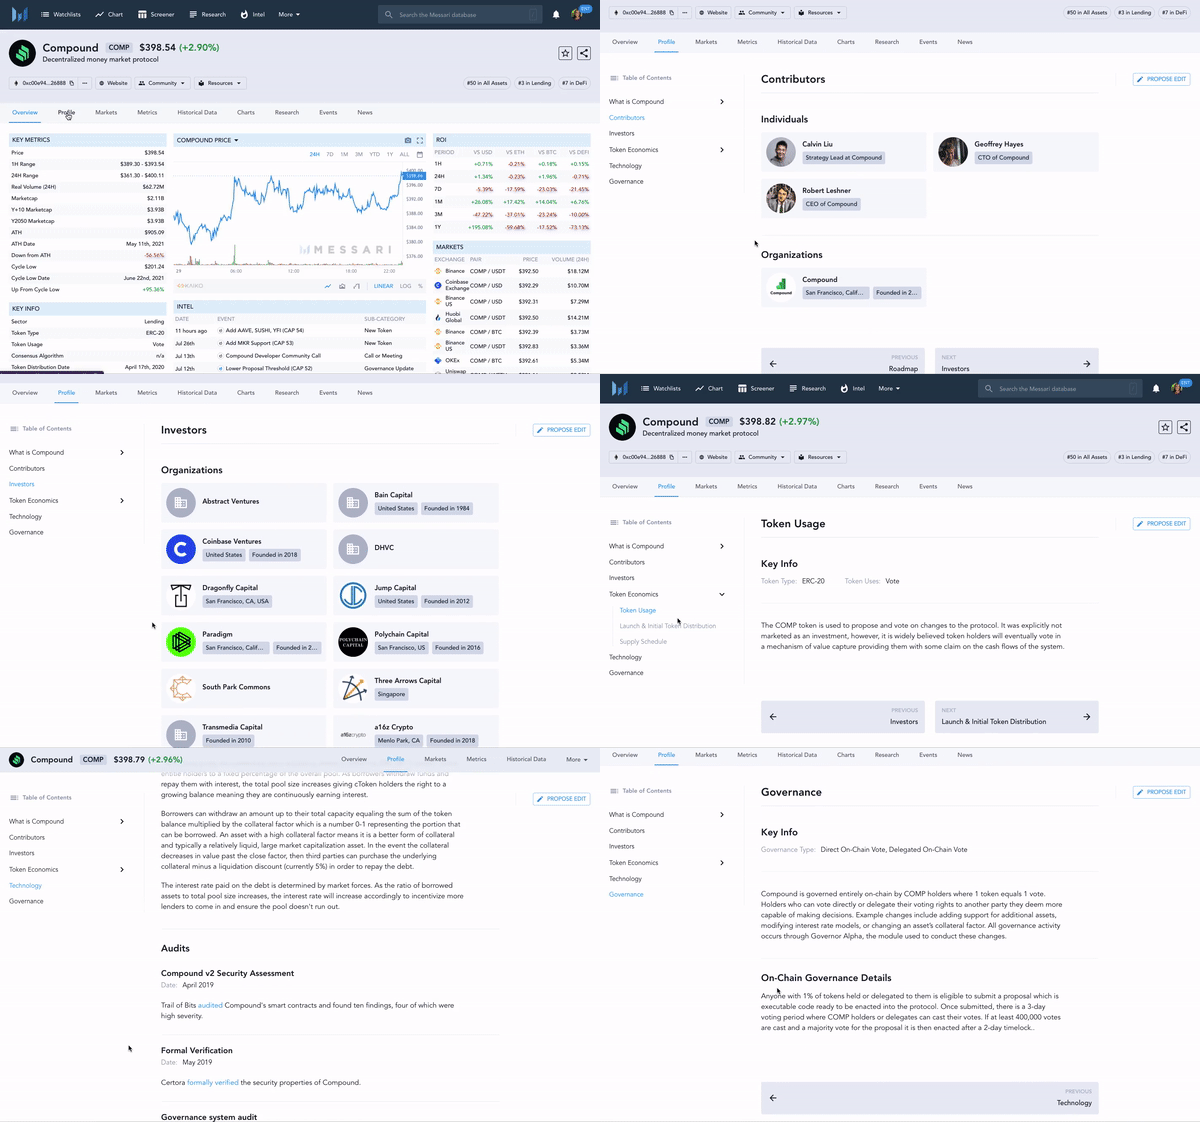
Each asset page is broken into tabs that provide qualitative and quantitative coverage, allowing you to dig even deeper. For qualitative discovery, our various tabs provide information on in-depth research, curated high-signal/low-noise project events and updates, aggregation of news from third parties, and a variety of project profile information including, but not limited to:
- History
- Founders and core contributors
- Funding rounds and investors
- Token Economics, Token Distribution
- Consensus mechanisms
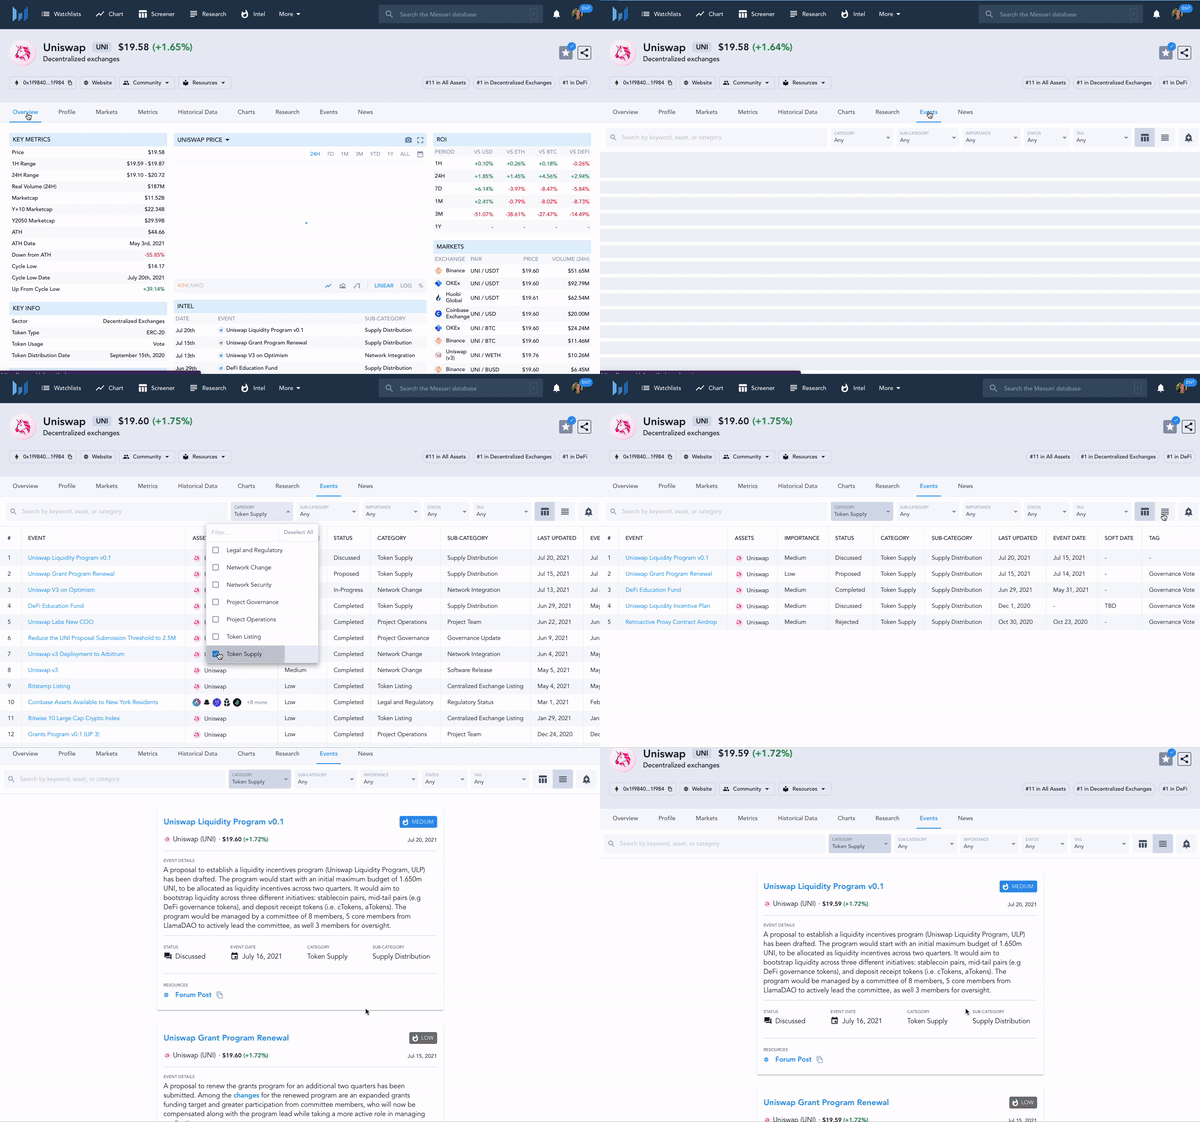
Pro Tip: With our Enterprise subscription, you can access a full list of key updates, categorized and synthesized, for a given asset. This includes software releases, forks, hacks or attacks, governance calls, key supply changes, and much more.
Coverage on Quantitative Stats
Having narrative context to an asset is critical, but without quantitative data, making pinpointed, sophistical industry decisions can be difficult. Luckily our asset page tabs also supply in-depth data and metrics that provide powerful filters in an easy-to-navigate interface. These quantitative details include:
- Price
- Live Markets
- Volume
- Market cap
- Supply
- Network activity
- Fees
- Revenue
- and more advanced on-chain data
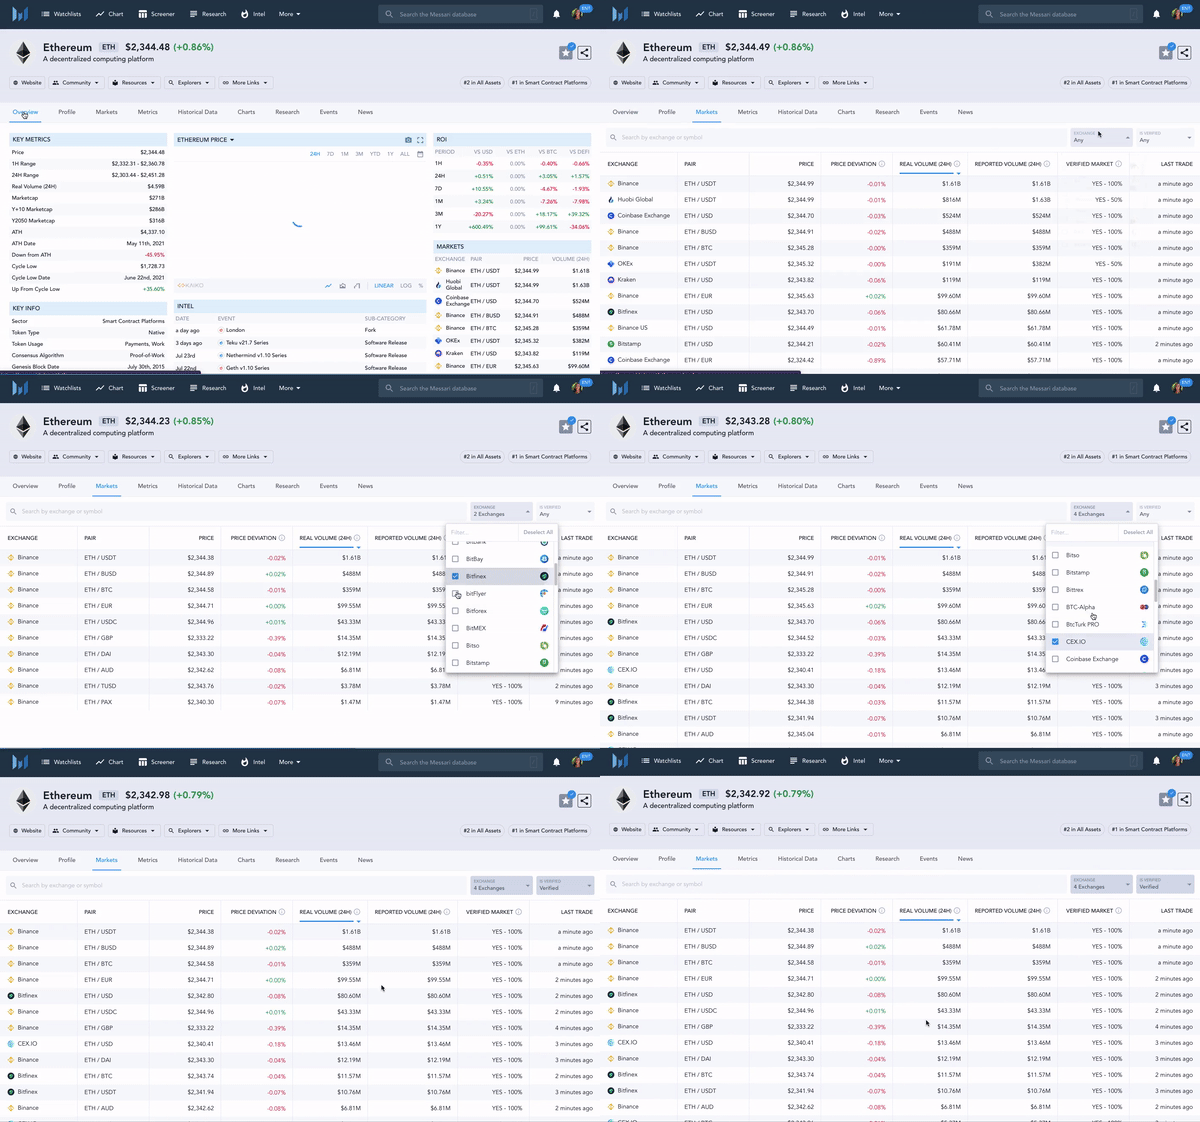
For a deeper dive, we explore Ethereum quantitative data discovered within the asset pages. The "Markets" tab allows you to filter by exchanges and view verified or unverified markets:
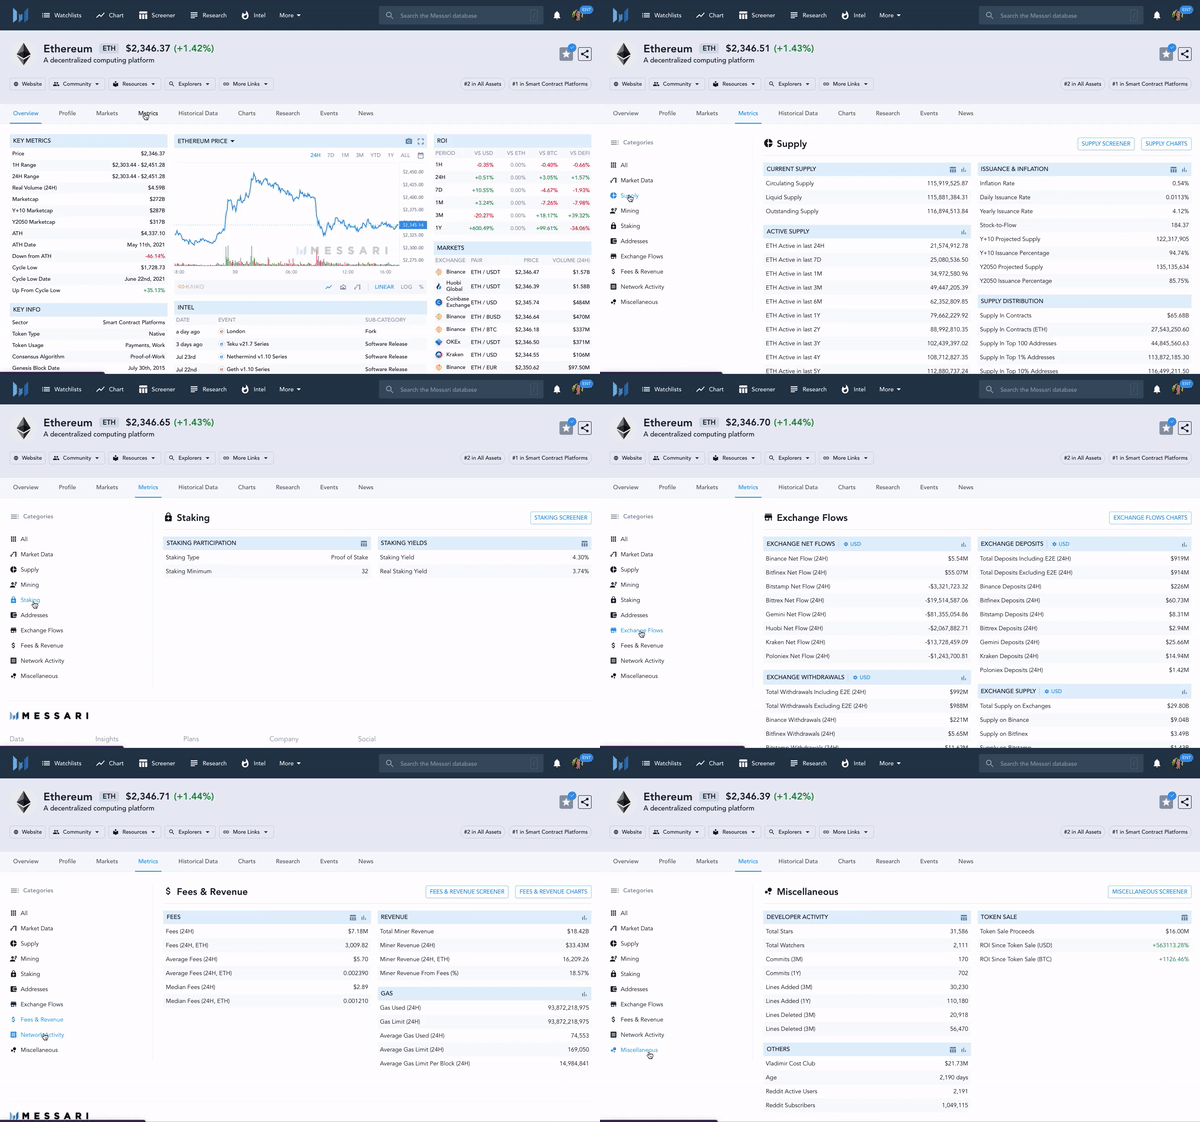
Within the “Metrics” tab, you are able to discover multiple data categories including market data, supply, mining, staking, addresses, and more:
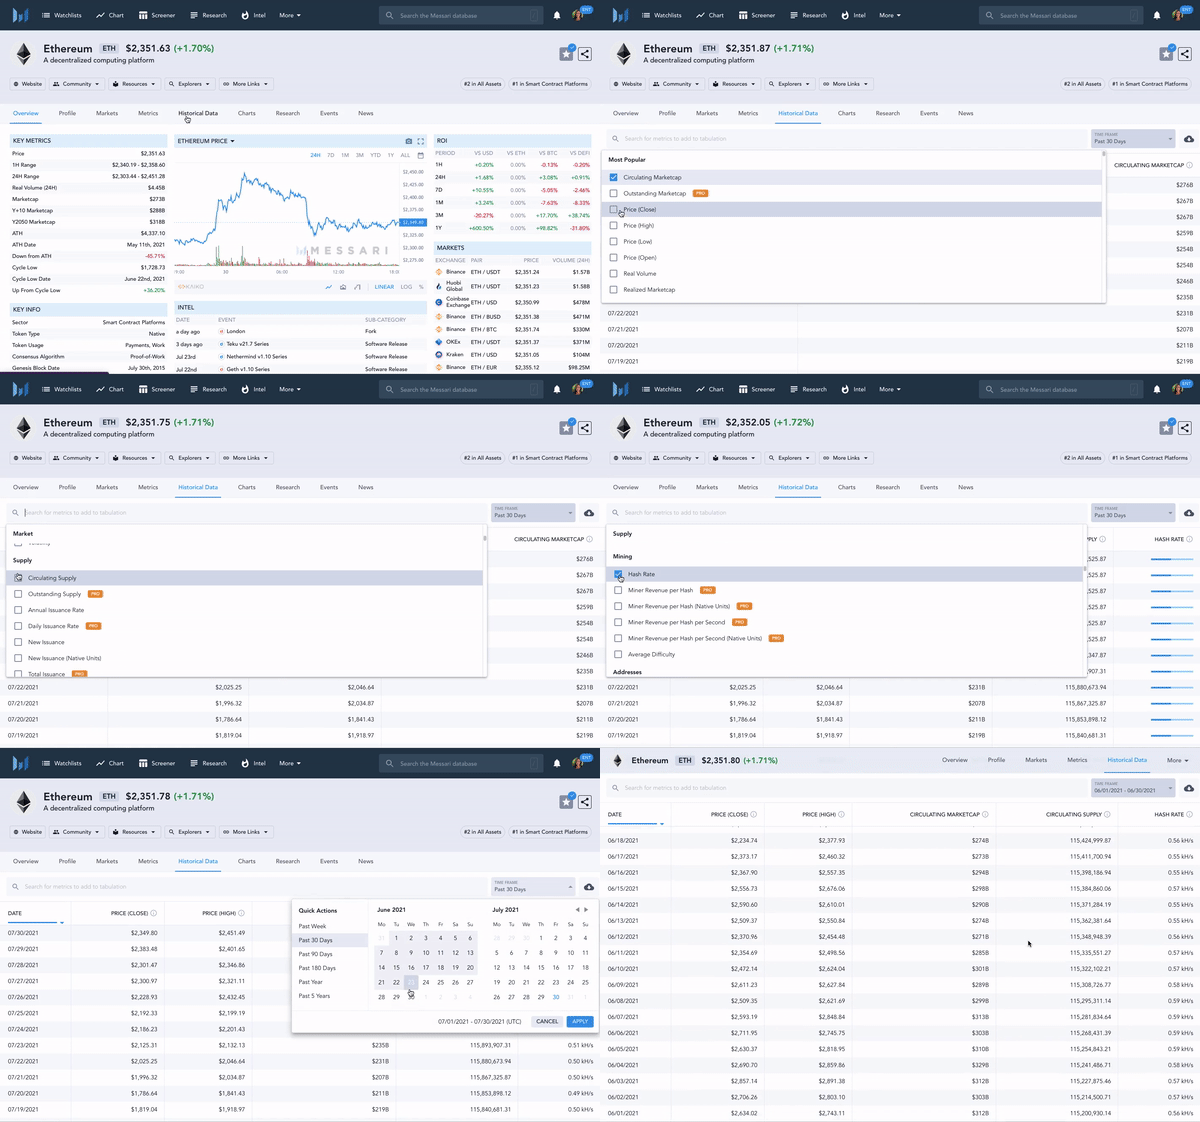
In the “Historical Data” tab, you can filter through dozens of metrics from markets, supply, mining, and more:
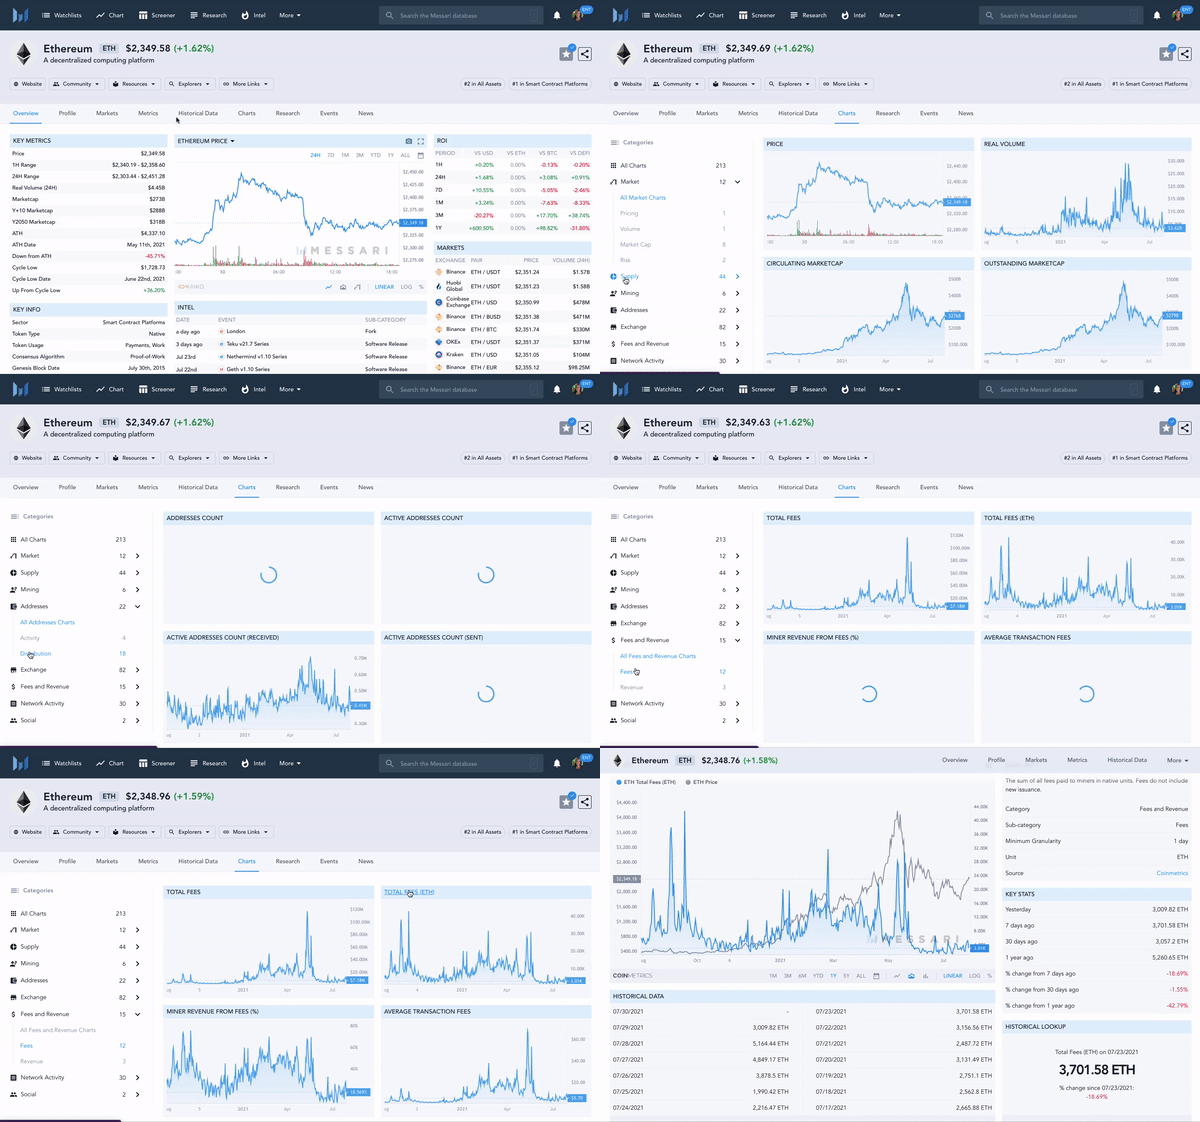
The “Charts” tab adds dynamic visual elements to your data discovery covering markets, supply, mining, address, and more. It also allows you to filter even further down into each category. For example, allowing you to see ETH total fees, displayed alongside key stats, basic info, and historical, lookups. It’s the ultimate way to get more context to your charting needs:
Pro Tip: Our Messari Pro users have even more options when searching through data points.As a Pro user, you can display and download any historical data for an asset from our historical data tab. From there, quickly access any historical data chart page in one click.
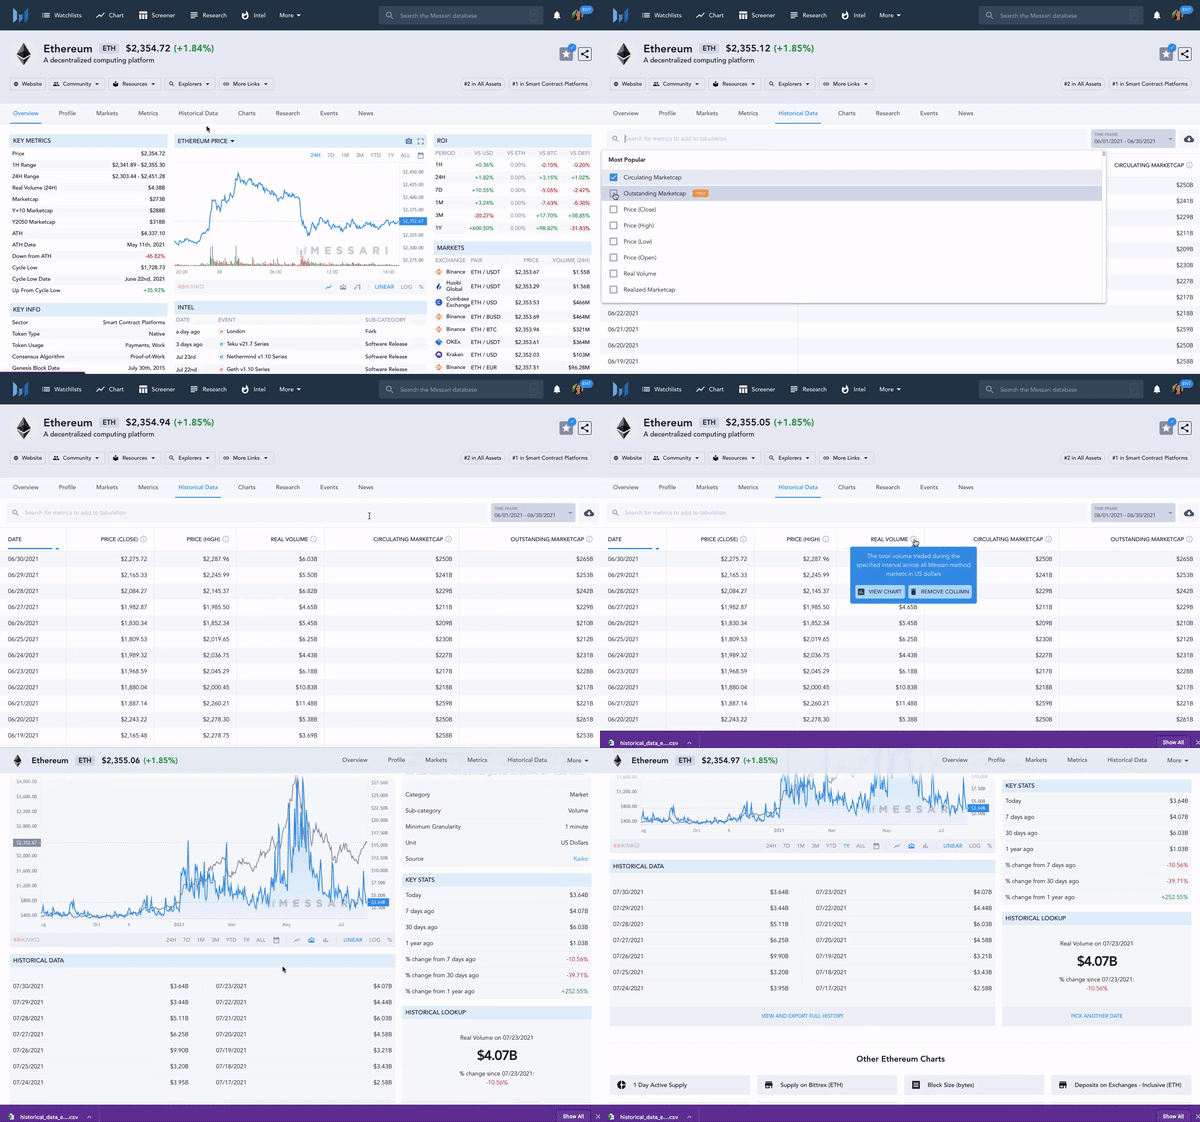
Messari’s new and improved asset pages allow you to say goodbye to the days of keeping dozens of tabs open to keep track of any given asset, and hello to more time for discovery and better strategic ecosystem participation decisions.
In the near future, we’ll be looking to add more DeFi fundamental datasets, governance information, visualizations, and many more cool things! Drop us a note on our product feedback survey so to let us know what you like, dislike, and what you’d want to see added!
Want even more functionality to your favorite asset pages? Sign up for Messari Pro’s free 7-day trial and get access to advanced charting tools, dozens of additional data filtering options, and more.
Watch our full demo video to see how you can best navigate Messari's Asset Pages.
