io.net’s original tokenomics relied on fixed emissions and price-dependent supplier income, leaving the network exposed to inflation, supply-side instability, and potential “death spiral” dynamics during downturns.
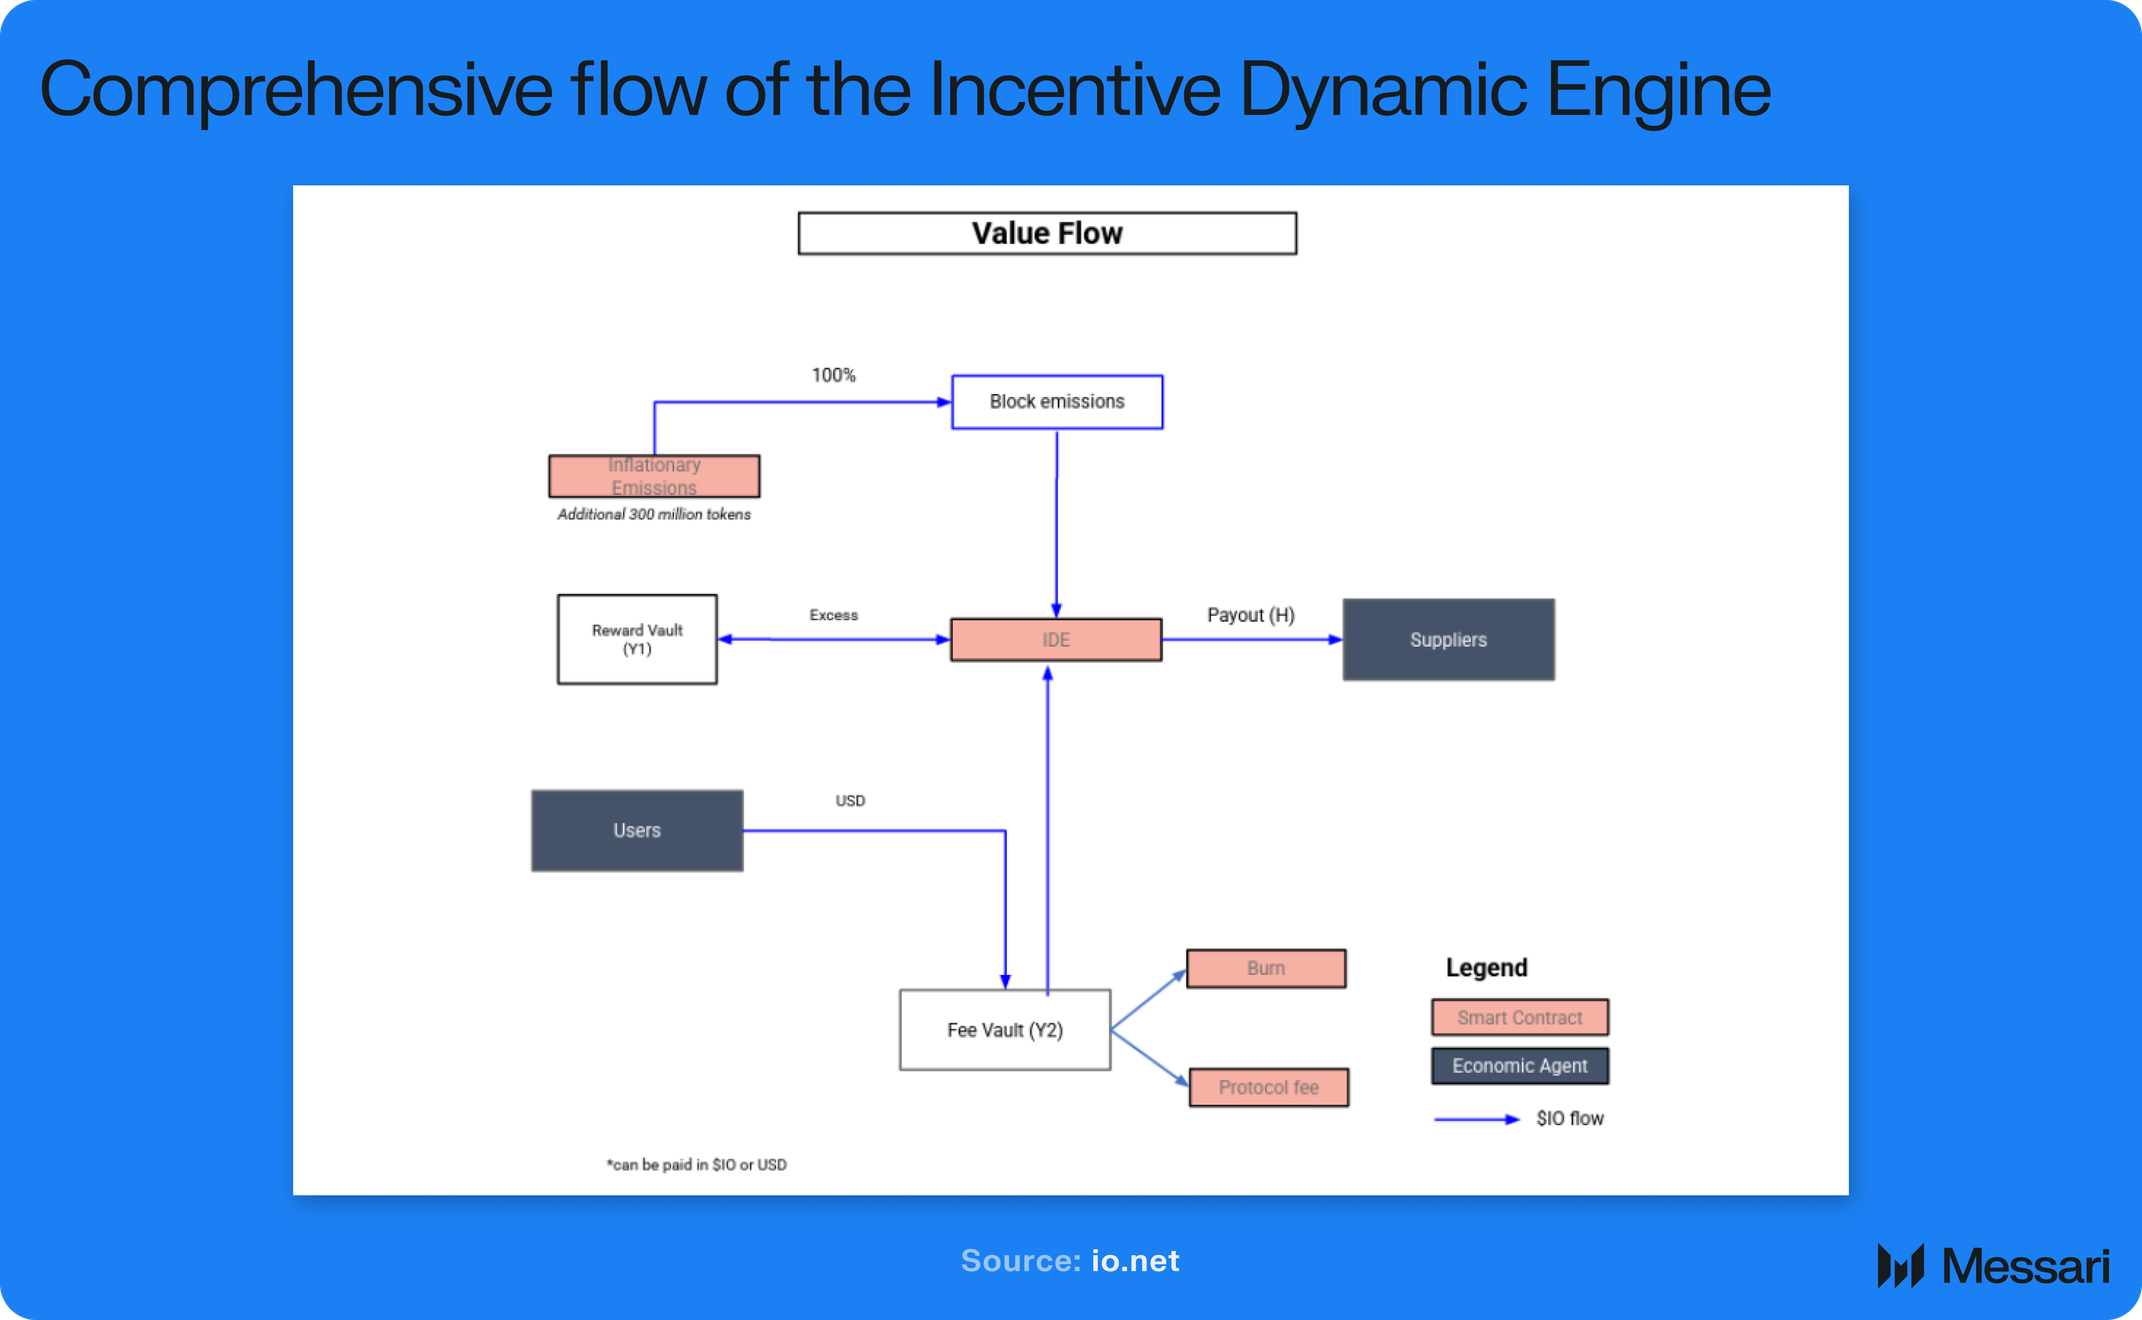
The new Incentive Dynamic Engine (IDE) replaces this with a demand-driven system that stabilizes GPU provider payouts in USD terms and dynamically adjusts token supply based on real-time revenue and token price.
A dual-vault mechanism (i.e., reward and fee vaults) ensures consistent payouts by prioritizing reserves and fee income, allowing the protocol to buffer shocks such as delayed client payments or market volatility.
Stress test simulations have demonstrated that the IDE effectively sustains supplier income and network operation under scenarios like 50% token price crashes or 55% demand drops, while flagging risks like reserve depletion if underpricing persists.
Primer
The artificial intelligence (AI) market, valued at ~$184 billion in 2024, is projected to reach ~$826 billion by 2030. However, it faces multiple bottlenecks, one of which is compute power. The rising demand for training large-scale AI models has driven graphics processing unit (GPU) shortages, causing prices for high-performance chips, such as NVIDIA's H100, to reach $40,000 per unit, making it difficult for companies to access scalable and affordable computing resources.
io.net (IO) addresses these challenges through a decentralized computing network, aggregating underutilized enterprise-grade GPUs across six continents and 50+ countries to provide on-demand, scalable, and cost-efficient AI computing infrastructure. Specifically, its framework uses Ray-based distributed computing to optimize clustering, task orchestration, and parallelized workloads.
The io.net ecosystem includes (i) IO Cloud, a decentralized GPU marketplace that allows dynamic workload scaling for AI/ML applications; (ii) IO Intelligence, an AI infrastructure platform offering pre-trained models and AI agents; (iii) IO Worker, an interface for GPU providers to contribute resources and manage their earnings; (iv) IO Staking, a platform for tracking and managing co-staking allocations within the network; (v) IO Explorer, a monitoring tool that provides real-time insights into compute usage, performance metrics, and network activity for the entire IOG Network; and (vi) IO ID, a platform for tracking earnings, monitoring balance updates, and withdrawing funds.
The existing io.net token economy is built on a supply-driven model. Specifically, it issues a fixed amount of IO tokens on a monthly schedule and has a capped total supply (~800 million) to be released over time. This emission plan successfully bootstrapped an initial GPU provider network; however, it has various limitations that compromise its long-term sustainability.
Specifically, on the provider side: (i) GPU suppliers are compensated in IO tokens, meaning their earnings are directly tied to token price volatility; and (ii) many providers require an IO price of $1.20–$1.50 to break even. This makes their operations unprofitable during severe price declines and could expose the network to the risk of supplier attrition during downturns. This, in turn, has the potential to threaten overall service reliability. On the tokenholder side: (i) IO has limited utility beyond paying for compute services, it does not guarantee governance rights or accrue value, so its price is largely driven by speculation and network usage; and (ii) token ownership is skewed, with early investors projected to hold 33% of the circulating supply by 2027, introducing potential sell pressure. At the protocol level: (i) emissions are fixed and do not adjust dynamically to changes in demand, meaning tokens are released regardless of actual usage; and (ii) the burn mechanism; 0.25% of each job’s reservation fee is insufficient in offsetting the ongoing issuance, leading to persistent inflation as token issuance continues even while activity stagnates.
Overall, the current model lacks a counter-cyclical mechanism that adjusts emissions during periods of low demand, resulting in persistent inflationary pressure. This creates challenges for maintaining stable supplier income and long-term token value. To address these limitations, io.net is introducing the Incentive Dynamic Engine (IDE), a demand-responsive system designed to align token issuance with actual network usage while providing more predictable rewards to suppliers.
The Solution: Incentive Dynamic Engine (IDE)
To overcome the limitations of conventional DePIN tokenomics, io.net is implementing the Incentive Dynamic Engine (IDE), a novel, demand-driven architecture for distributed compute networks. Like most DePIN protocols, io.net initially used a fixed-emissions model to bootstrap supply. While effective in early stages, such supply-led models often struggle with long-term sustainability and volatility. The IDE introduces a new approach: a dynamic system of two interlinked vaults (i.e., Y1 and Y2) that buffer and adjust token issuance in real time, with the goal of stabilizing GPU providers’ payouts in USD terms. This marks io.net as the first distributed compute network to transition from speculative emissions toward a utility-aligned incentive model designed for durability at scale.
For example, every hour, the IDE calculates the hourly USD payout target required to give all active GPU providers their promised returns. This target is calculated as a function of the number of GPUs serving the network and a desired ROI per GPU (plus any operating overhead). Using a real-time price feed for IO, the engine determines exactly how many tokens are needed to deliver that dollar amount. Essentially, if the token’s market price is low, more tokens are required to meet the same USD target, and if the price is high, fewer tokens are needed. This ensures that supplier rewards (in USD) remain consistent even as the token price fluctuates.
Furthermore, the IDE’s vault mechanism will manage the source of the payout tokens. Two vaults will serve as sources of IO for paying suppliers. The reward vault (Y1) holds a reserve of tokens (built up during surplus times or allocated for rewards). The fee vault (Y2) accumulates the actual revenue from users (i.e., the USD fees that clients pay for compute jobs), which can be converted into IO or held as stablecoins. When a payout is due, the system will draw from Y1 first to pay suppliers their IO. If Y1 alone is insufficient, it will then use funds from Y2 to cover the remainder.
Importantly, Y2 also buffers against payment delays which are common in enterprise contexts with net-30 or net-60 terms, by allowing Y1 to bridge the gap in the interim, guaranteeing uninterrupted supplier income.
What It Means Going Forward
With the IDE implemented, io.net’s token economy evolves from a system vulnerable to market volatility, into a more robust and flexible model. The differences between the pre-IDE and post-IDE regimes can be summarized simply as follows:
Fixed vs. Demand-Driven Emission: Previously, token emissions were predetermined and linear, ignoring market conditions. Now, emissions are driven by demand and revenue – the network mints or burns tokens based on real usage and price signals.
Volatile vs. Stable Supplier ROI: Under the old model, GPU providers’ return on investment (ROI) swung wildly with IO’s price. A bear market could cut their earnings in half or worse, jeopardizing their ROI. Under the IDE model, the ROI for suppliers is maintained at the target level, regardless of short-term market fluctuations. The guaranteed USD payouts mean a provider’s income is predictable and does not collapse when the token price does. This stability prevents supplier exodus in downturns.
Weak vs. Buffered Network Resilience: The old tokenomics had no built-in shock absorbers – there was nothing to stop a downward spiral if demand or token price crashed. In the new system, io.net’s economy is buffered by the two vaults and the adaptive supply mechanism. During a demand drought or price crash, the Reward Vault and Fee Vault serve as a cushion, ensuring operations continue and providing the protocol with time to recover. This makes the network far more resilient to volatility and extreme scenarios than before.
Hypothetical Scenarios
To better understand how the IDE model performs in practice, simulation studies and stress tests were conducted, revealing a clear contrast between the network’s behavior before and after its implementation.
Drop in User Demand
In one scenario simulating a 55% drop in user demand, the IDE maintained supplier payouts at the target ROI by drawing on reserves from the Reward Vault. Despite the steep revenue decline, suppliers continued to receive consistent earnings, preventing a mass exodus of providers. Under the old model, such a shock would have severely reduced block rewards and likely triggered widespread disconnections. In another test, where the IO token price crashed by 50%, the IDE absorbed the impact by issuing roughly twice the number of tokens to meet the same USD payout. This kept supplier incomes stable despite market volatility, highlighting the value of price-pegged emissions. While this approach does draw more heavily from reserves, it prevents service disruption and discourages supplier flight, a vulnerability the prior system could not mitigate.
Drop in IO Price
In a test where the IO market price crashed by 50%, the IDE system likewise absorbed the shock. Because IO was suddenly worth half as much, he engine responded by distributing roughly twice the number of tokens from the existing supply (temporarily increasing the net change in circulating tokens per hour) to meet the USD payout target. This ensured that suppliers still received the same dollar value for their work. The token’s price drop did not translate into a corresponding loss of income for providers, proving the effectiveness of the price-pegged emission logic. Of course, such an event would use up more of the reserve, but the network remained operational and attractive to suppliers, whereas under the old tokenomics, many would have abandoned ship.
Underpricing of Fees
A further simulation tested the network’s response to persistent under-pricing of fees relative to supplier payouts. When revenue fell short of covering the target payout, the vaults gradually depleted, revealing that IDE cannot indefinitely subsidize deficits. The model flagged this as unsustainable, implying governance intervention (e.g., adjusting fees) would be required if the sustainability ratio, defined as actual revenue divided by the hourly payout target, remained significantly below one. This ratio, referred to as psi, serves as a key indicator of the protocol's financial health: if it falls below one, the network is operating at a deficit and relying on reserves to function.
Taken together, these stress tests demonstrate that the IDE is effective in absorbing short-term disruptions, while also highlighting the importance of aligning fee revenue with supplier payouts. On a broader level, simulations suggest that the IDE enables a disinflationary token issuance pattern, beginning around 8% annually and decreasing by roughly 1% each month, without exceeding the fixed 800 million token cap. This controlled, tapering supply schedule contrasts with the previous model’s unchecked emissions, marking a shift toward long-term sustainability. Over time, token issuance slows and eventually halts entirely, reducing dilution risk and contributing to a healthier, more stable token economy.
KPIs to Track
To ensure the IDE system remains effective, several Key Performance Indicators (KPIs) can be tracked. These KPIs allow the community and investors to monitor the network’s financial health going forward:
Sustainability Ratio (ψ): As defined, ψ = revenue/payout. It indicates whether the protocol is in surplus or deficit at any given time. ψ ≥ one is healthy, and vice versa, ψ < means the network is subsidizing payouts by drawing additional tokens from the reward vault to cover a shortfall.
Reserve Runway: This measures how long the reward vault (Y1) can continue to pay suppliers if the network remains in a deficit (ψ < one) and no new revenue is generated. For example, a six-month runway means the vault can uphold payouts for half a year of bad market conditions. The protocol aims to maintain a minimum 6–12 month reserve runway as a safety margin.
Reward Vault Balance: This is the current token balance in Y1, which directly reflects the protocol’s economic buffer capacity. When the network is doing well (ψ > one), this balance should grow (excess tokens or fees flowing into the vault). When the network is in a slump (ψ < one), this balance will be drawn down. Monitoring the vault’s balance (and its trend over time) shows whether the network is building resilience or eroding its safety net.
Token Burn Volume: With IDE, a portion of user fees can be used to buy back and burn IO tokens when the system is in surplus. This metric tracks the number of tokens being burned over time.
Closing Summary
Ultimately, moving forward under IDE, io.net is positioned for greater stability and sustainability. The network can weather demand swings and price volatility much more gracefully while GPU suppliers enjoy reliable earnings, which keeps them onboard (and the compute capacity online) even in tough times, thereby preserving the utility of the platform. The token supply process has become intelligent and responsive: inflation is no longer an ever-present cloud but is applied only as needed, with balancing deflationary measures when possible. For token holders and investors, these changes promise a more predictable and investable economic system, which bodes well for long-term confidence in the IO token. With the technical changes of IDE in place, it’s important to understand how this impacts each stakeholder group within the io.net ecosystem. The next section breaks down what IDE means for suppliers, tokenholders, and investors, and discusses the benefits and remaining concerns for each.
This report was commissioned by . All content was produced independently by the author(s) and does not necessarily reflect the opinions of Messari, Inc. or the organization that requested the report. The commissioning organization may have input on the content of the report, but Messari maintains editorial control over the final report to retain data accuracy and objectivity. Author(s) may hold cryptocurrencies named in this report. This report is meant for informational purposes only. It is not meant to serve as investment advice. You should conduct your own research and consult an independent financial, tax, or legal advisor before making any investment decisions. Past performance of any asset is not indicative of future results. Please see our Terms of Service for more information.
No part of this report may be (a) copied, photocopied, duplicated in any form by any means or (b) redistributed without the prior written consent of Messari®.