Ethereum November 2025 Update

Fundamentals
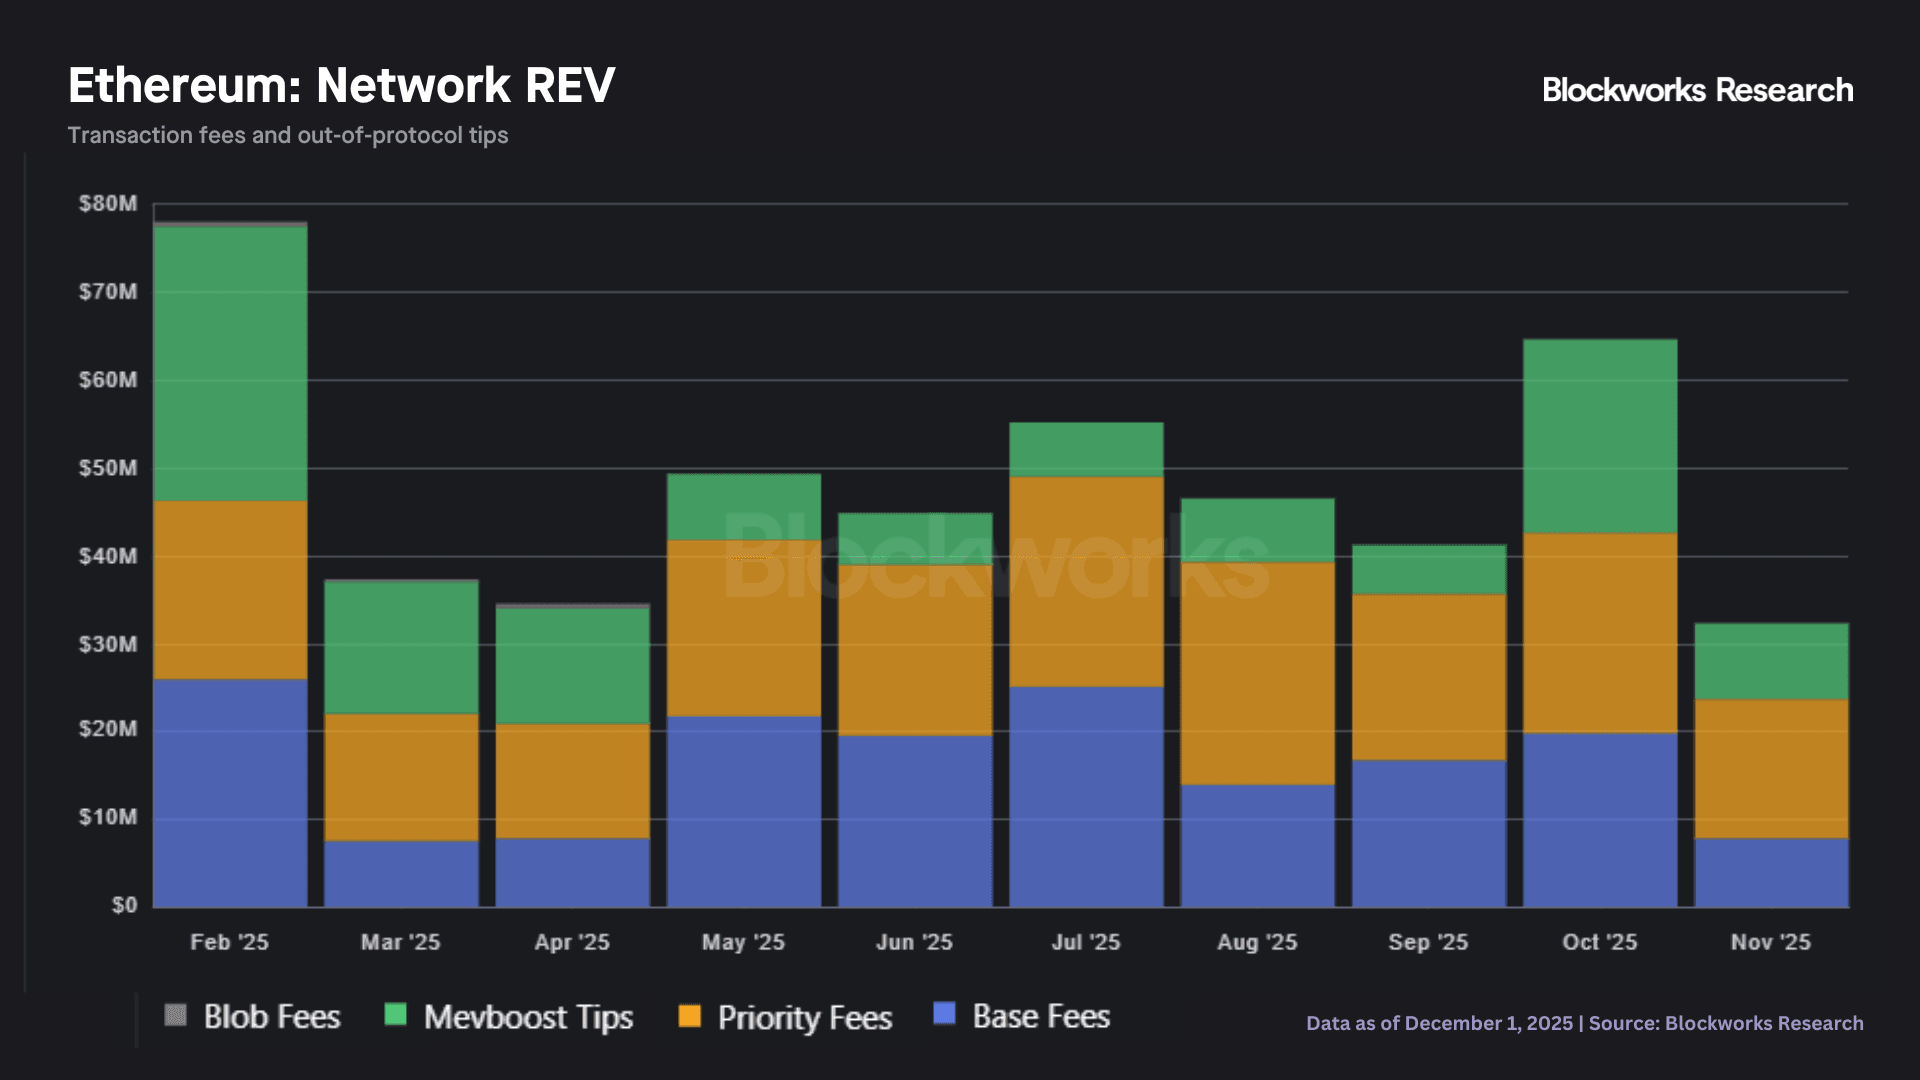
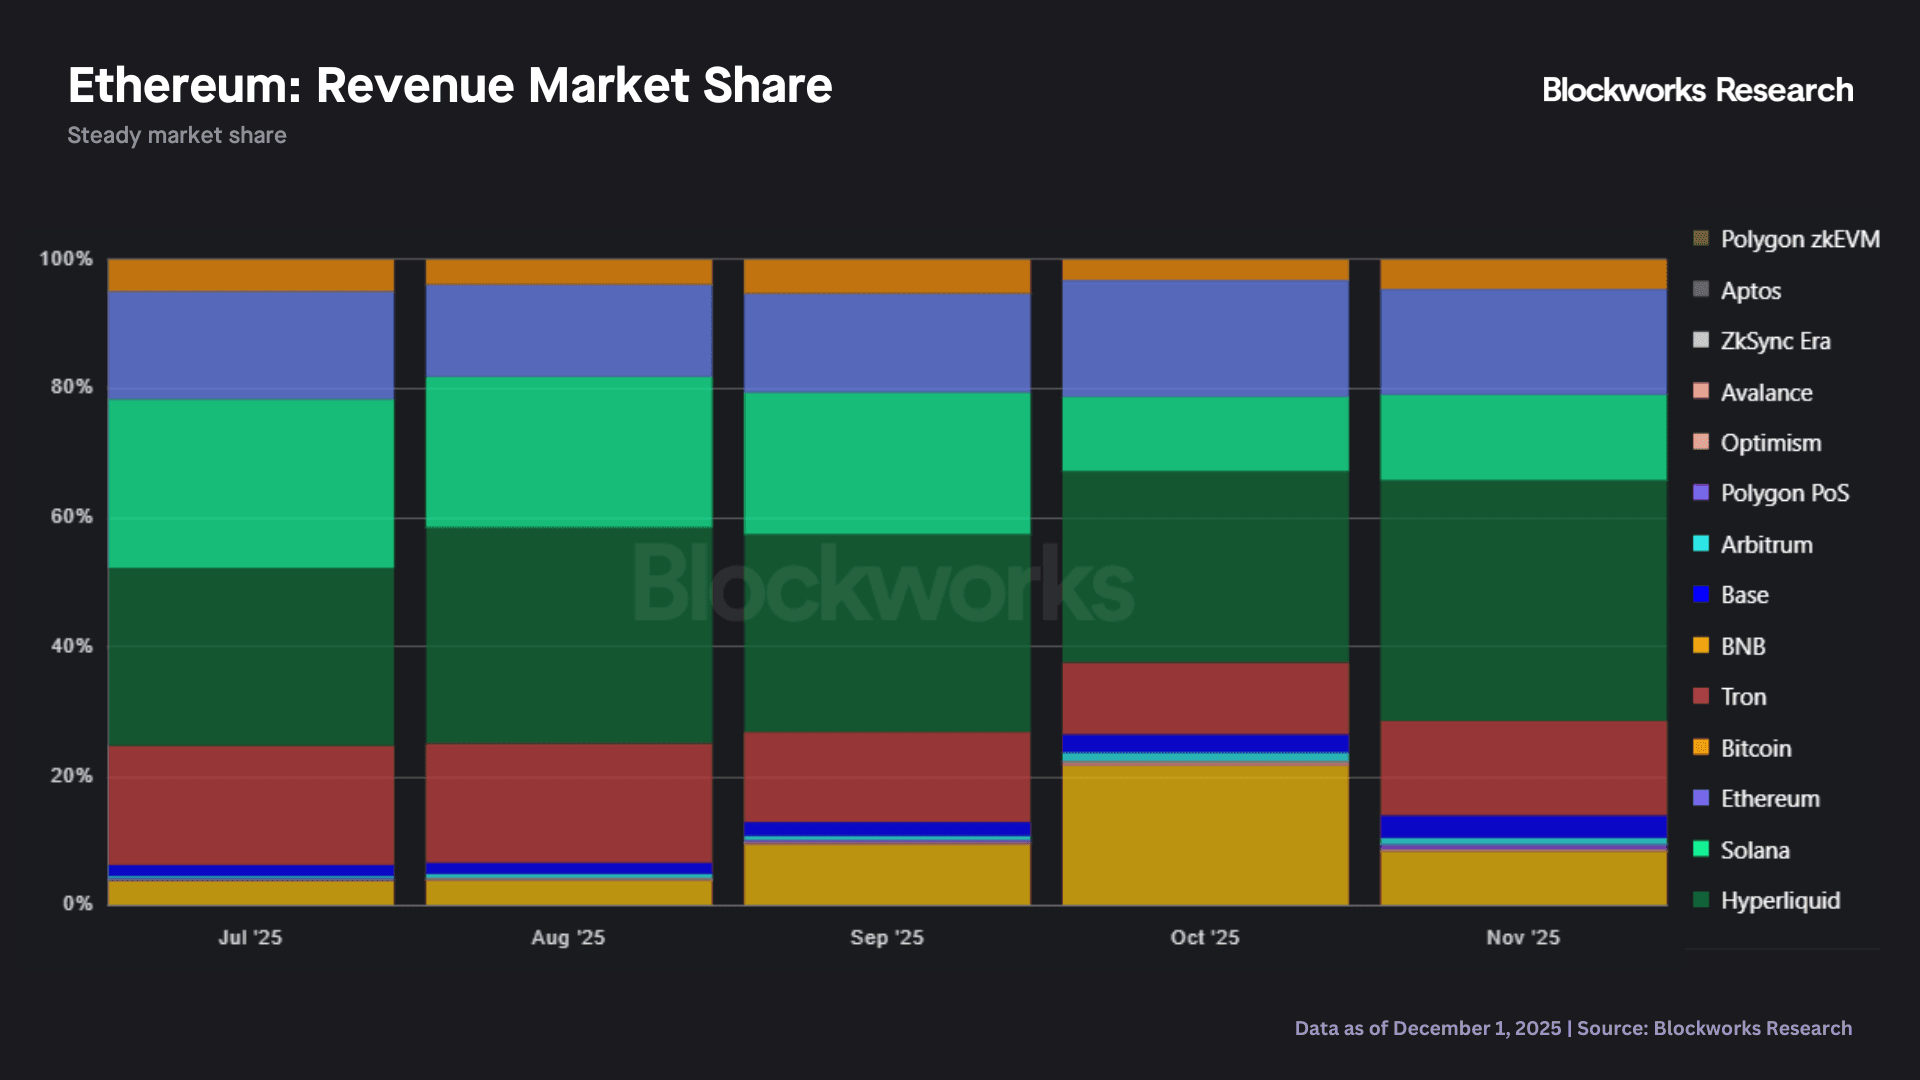
Ethereum’s Real Economic Value (REV) fell sharply in November, dropping to its lowest monthly level of 2025 at roughly $32M. The decline followed October’s liquidation-driven spike and reflects a return to structurally softer onchain activity. With volatility subsiding and transactional intensity easing across DeFi, fees contracted meaningfully (down 50% MoM). November’s print underscores how dependent revenue has become on episodic stress events, with organic demand insufficient to sustain elevated network fee levels in calmer market conditions.In November 2025, Ethereum’s share of Network Revenue fell to ~16%, up from ~18% in October. The loss reflected a relative decrease in mainnet activity amid decreased market volatility. Ethereum held the second-largest share of network revenue for the first time since February 2025. It surpassed Solana (13%) for the second month in a row, with Hyperliquid taking the lead (37%). The chart below tracks Network Revenue share across major chains over the past few months.
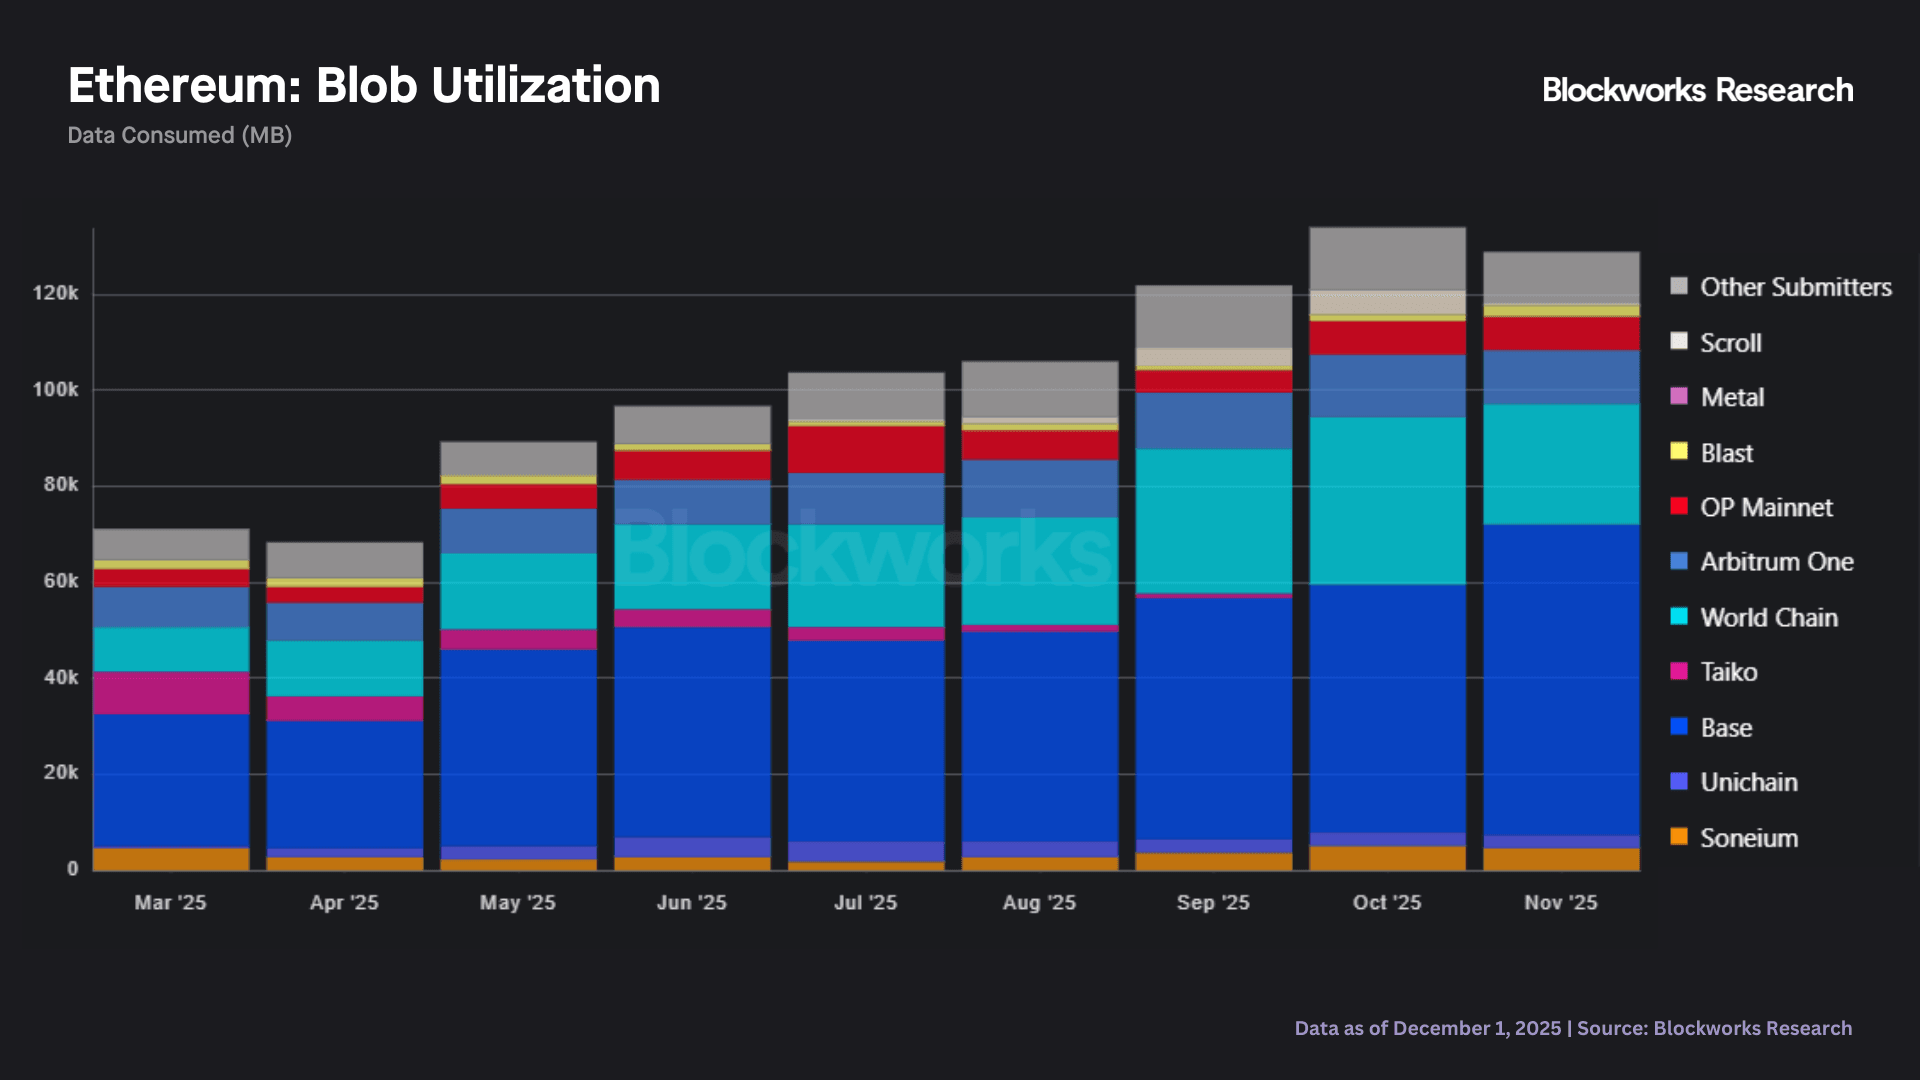
In November 2025, Ethereum extended its lead in the data availability (DA) market, capturing nearly three-quarters of total data consumption (excluding EigenDA). The network’s share has steadily increased over the past several months as Celestia’s activity continued to taper following the mid-year surge tied to new rollup testnet launches. Ethereum’s regained dominance highlights its entrenched position as the default DA layer for L2s, buoyed by deep ecosystem integration and reliability, even as competitors seek to differentiate on modularity and cost efficiency. The chart below tracks the evolving DA market share between Ethereum and Celestia over the past year. Blob data availability (DA) usage declined in November for the first time since April, breaking a six-month streak of continuous growth following the Pectra upgrade’s increase of the blob target from 3 to 6. Total monthly blob consumption fell modestly from October’s all-time high, with average utilization easing as activity cooled across several major rollups, particularly Arbitrum, World Chain, and Base. November’s dip appears cyclical rather than structural, reflecting softer market-wide activity rather than any meaningful slowdown in rollup adoption. As attention turns to the upcoming Fusaka upgrade and its proposed “floor price” mechanism, variability in DA consumption may become increasingly important for long-term fee capture dynamics.
Ethereum DEX activity declined more noticeably in November, falling to roughly $72B, the lowest level since early summer and down sharply from October’s ~$93B. The drop aligned with subdued market volatility, narrower trading ranges, and reduced speculative activity across both majors and long-tail assets. Stablecoin-to-stablecoin swaps remained the largest share of volume (50%), though they also contracted meaningfully month-over-month. ETH-stablecoin pairs and BTC pairs saw similar pullbacks, while liquidity in project tokens, LSTs, and tokenized assets thinned further as traders rotated out of risk. Despite the slowdown, overall DEX throughput remains structurally higher than in the first half of the year. The chart below breaks down monthly Ethereum DEX volumes by pair category.

Marc covers Ethereum, Bitcoin and their L2s. Previously led Ethereum and DeFi research at CoinShares.