Data Decoded: Synthetix

Our new Dune Dashboard tracks KPIs for Synthetix, a leading DeFi protocol for synthetic assets and perpetual futures trading. This document complements the dashboard and explains the metrics, guiding investors to make data-driven decisions about the protocol.
Revenue
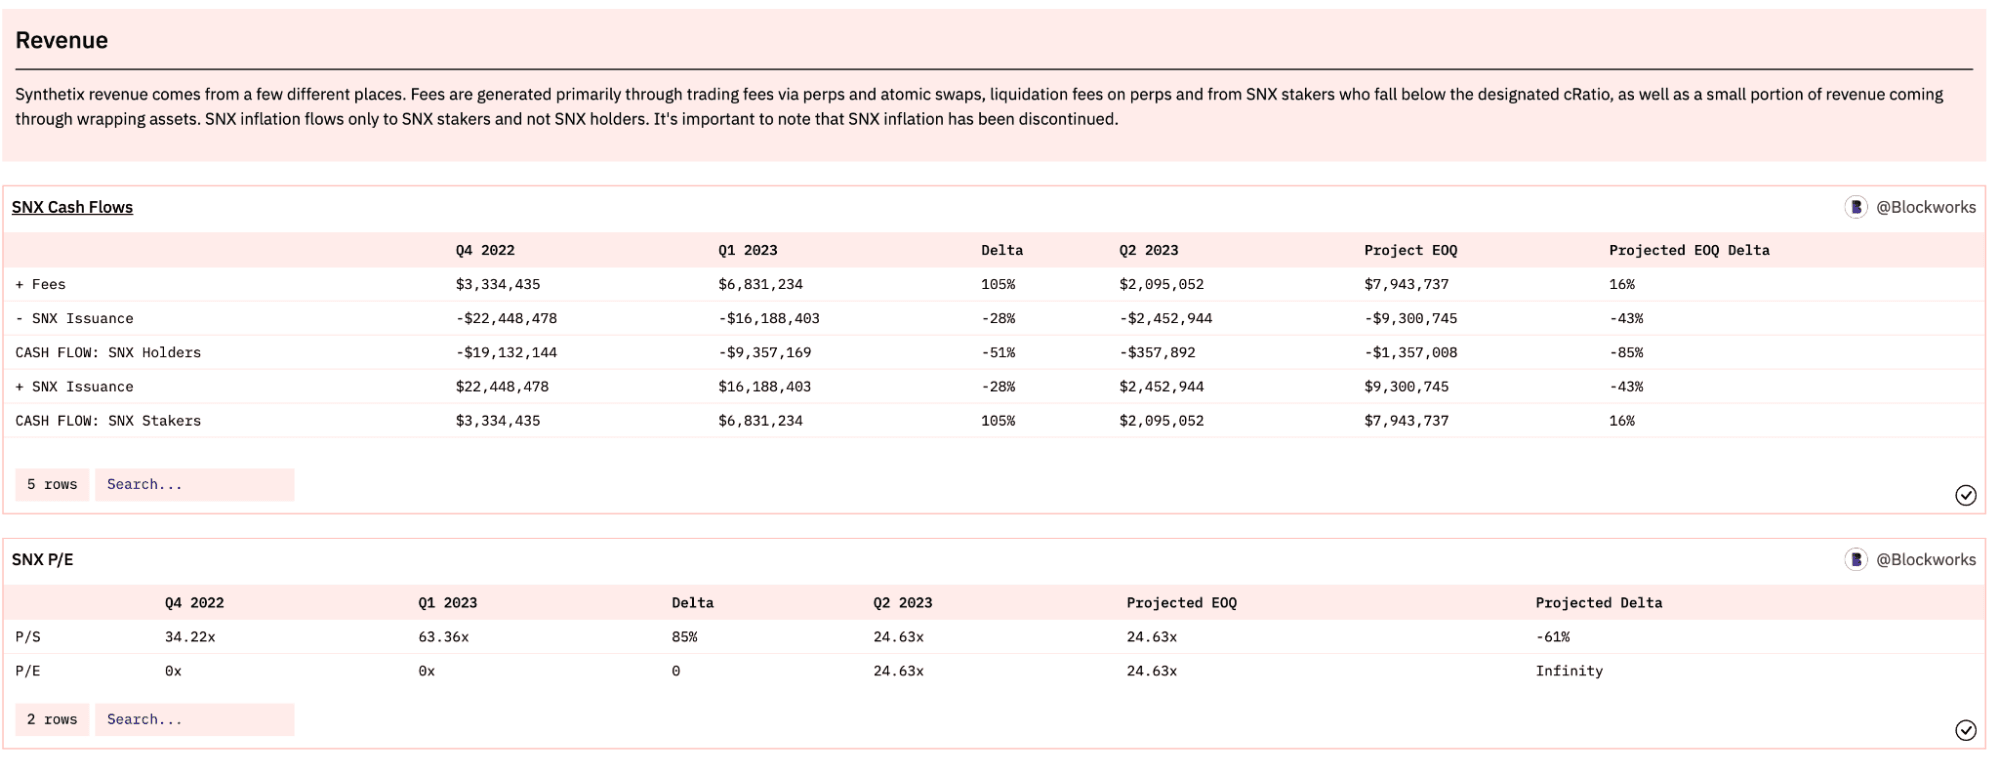
Synthetix generates revenue from a variety of sources. The primary source of revenue comes through trading fees for perpetual futures and their liquidations. They also generate revenue through fees from atomic swaps on the L1, liquidations of SNX stakers who fall below the defined cRatio, and wrapping assets into synths (e.g. ETH to sETH).
Our first section takes a look at these revenue numbers, as they are the best way to value the network based on value flows. The first table looks at the value flow of Synthetix, both the flows that go to all SNX holders who get diluted via inflation, as well as value flows accruing to stakers who receive inflation and protocol fees. Synthetix had its best quarter yet in Q1, with almost $7M in revenue flowing to stakers.
Then, we take a look at the price to earnings and price to sales ratios based on these numbers. We annualize the sales, also known as the amount of total revenue brought in, and earnings, which is revenue minus any costs or emissions, and divide by the circulating market cap. If earnings are negative, we define this multiple as zero.
Since the revolution will not be quarterly reported, we also show real time fees with moving averages, as well as a P/S MA over time to show how the asset is trading with respect to its fundamental cash flows. The 30D MA for the P/S ratio is currently hovering around 30x, the cheapest SNX has been in relation to its fundamentals in a long time.

Westie leads coverage on Ethereum, L2s, and Synthetix. Previously he worked in public sector technology Consulting at Guidehouse.