Bottom Signals

Diminishing Returns and the Case for Conditional Exposure
BTC is flat since March 2021, and flat against the Nasdaq since November 2017, a period of nearly nine years. Measured to this point in time, BTC's performance against an equity index is flat over a very large timeframe, while the volatility carried over that period has been significantly higher. Adjusting for risk, BTC has underperformed.
This context matters for how the asset should be held. As BTC matures, it is reasonable to expect diminishing marginal returns in both directions, to the upside and to the downside. The passive, always-long exposure that rewarded holders through prior cycles earns progressively less, and outperformance increasingly requires identifying opportunistic times to be overweight or underweight.
Seeking to identify those opportunistic windows, the indicators presented in this report are condition-based signals that spend the vast majority of their history in uninformative territory and produce their strongest readings in the tails, only a handful of times per decade. Several of those readings are present now, simultaneously, each pointing towards a similar conclusion: BTC may be at or near a high-timeframe low.
The Nasdaq/BTC Relative Strength Signal
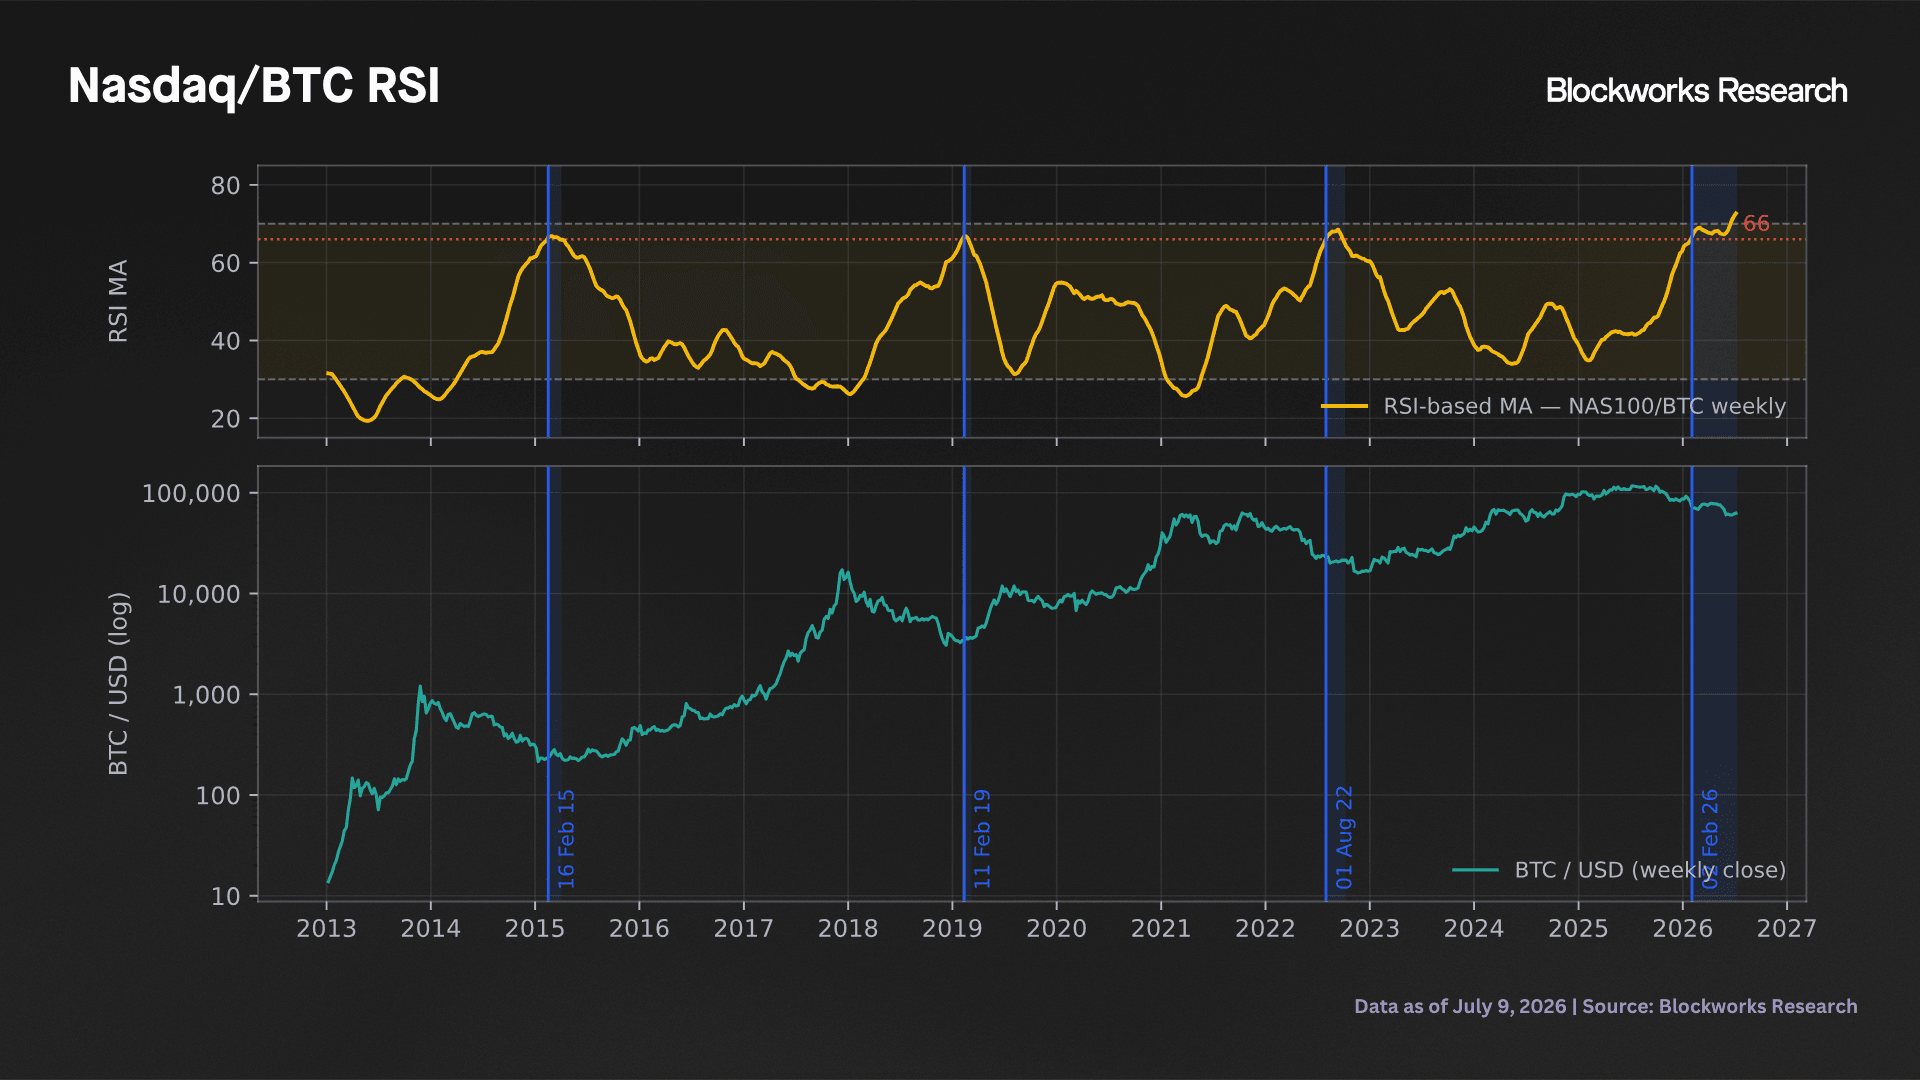
The first signal is constructed from the ratio of the Nasdaq 100 to BTC, measured on weekly closes over the previous 875 periods. We compute a 14-period RSI on the ratio and smooth it with a 14-period simple moving average. Elevated readings indicate the Nasdaq is overbought relative to BTC; depressed readings indicate the opposite. This is not a day-trading technical indicator. It is a 14-week moving average of a 14-week oscillator, where overbought and oversold conditions turn over on the scale of multi-year market cycles, not days or weeks.

Luke leads coverage on money markets, stablecoins, real world assets, interoperability, and intents-based infrastructure. Previously worked in market research and product at a startup incubator.