Aptos Tokenomics: Path to Deflation

Key Takeaways
- Aptos, built for money movement and high-frequency trading, now generates more from gas fees, which it burns in full, than it pays its operators. Token Holder Net Income (THNI), a Blockworks Research metric defined later in the report and not one endorsed by the Aptos Foundation, turned positive in May 2026 and has held since, while Ethereum and Sui still run negative and Solana sits only marginally positive.
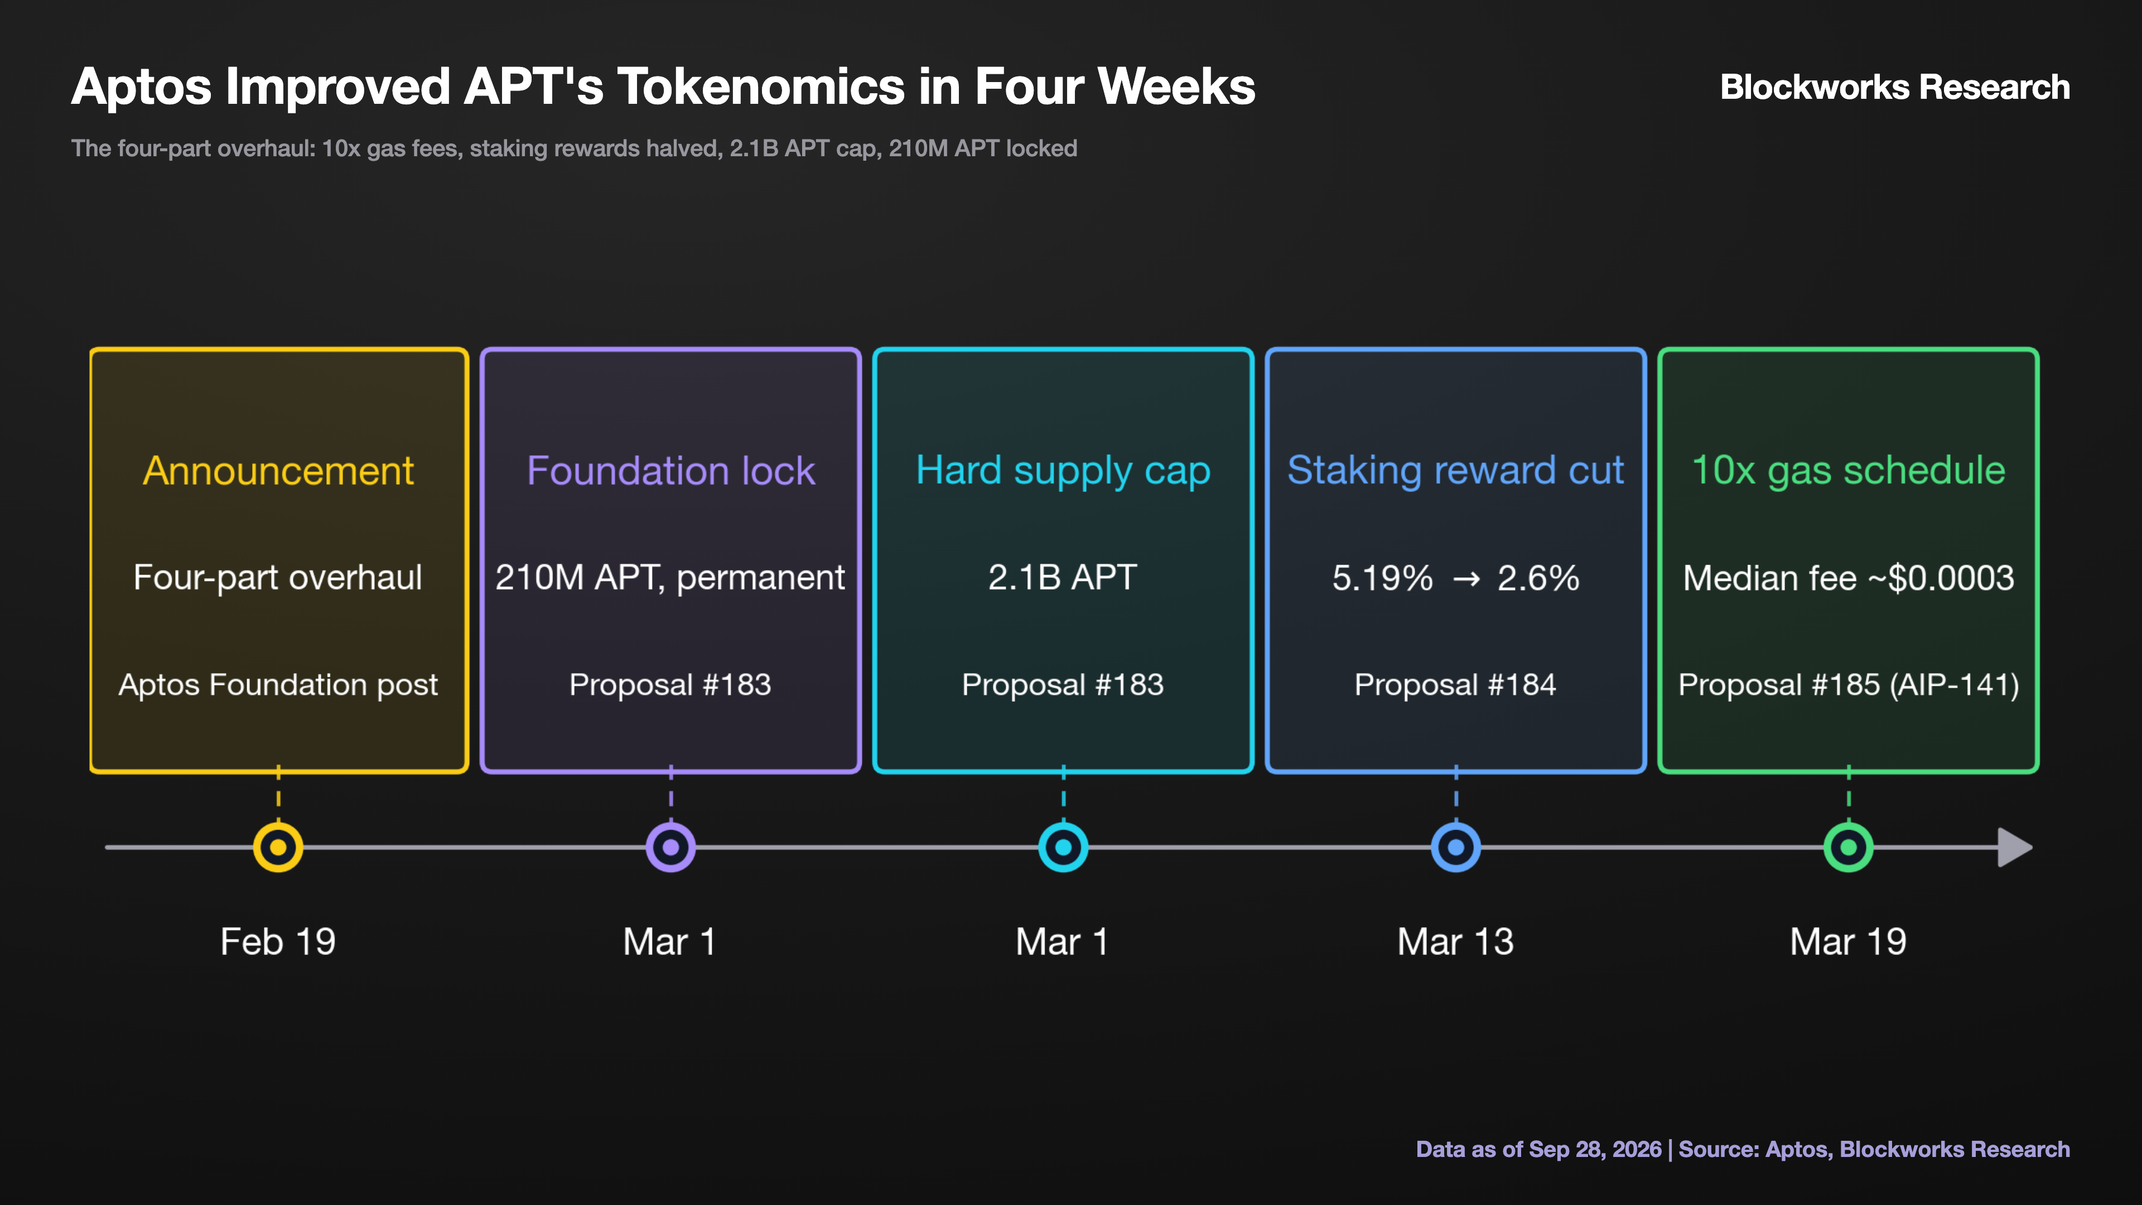
- The flip came from a four-part overhaul approved by tokenholder governance votes that took place in under a month. Between February 19 and March 19, Aptos tokenholders repriced gas 10x, halved staking rewards to a flat 2.6%, capped supply at 2.1B APT, and permanently locked 210M APT tokens. Net supply growth (staking issuance net of burn, measured on total supply) fell roughly 70%, from ~5% to ~1.5% a year.
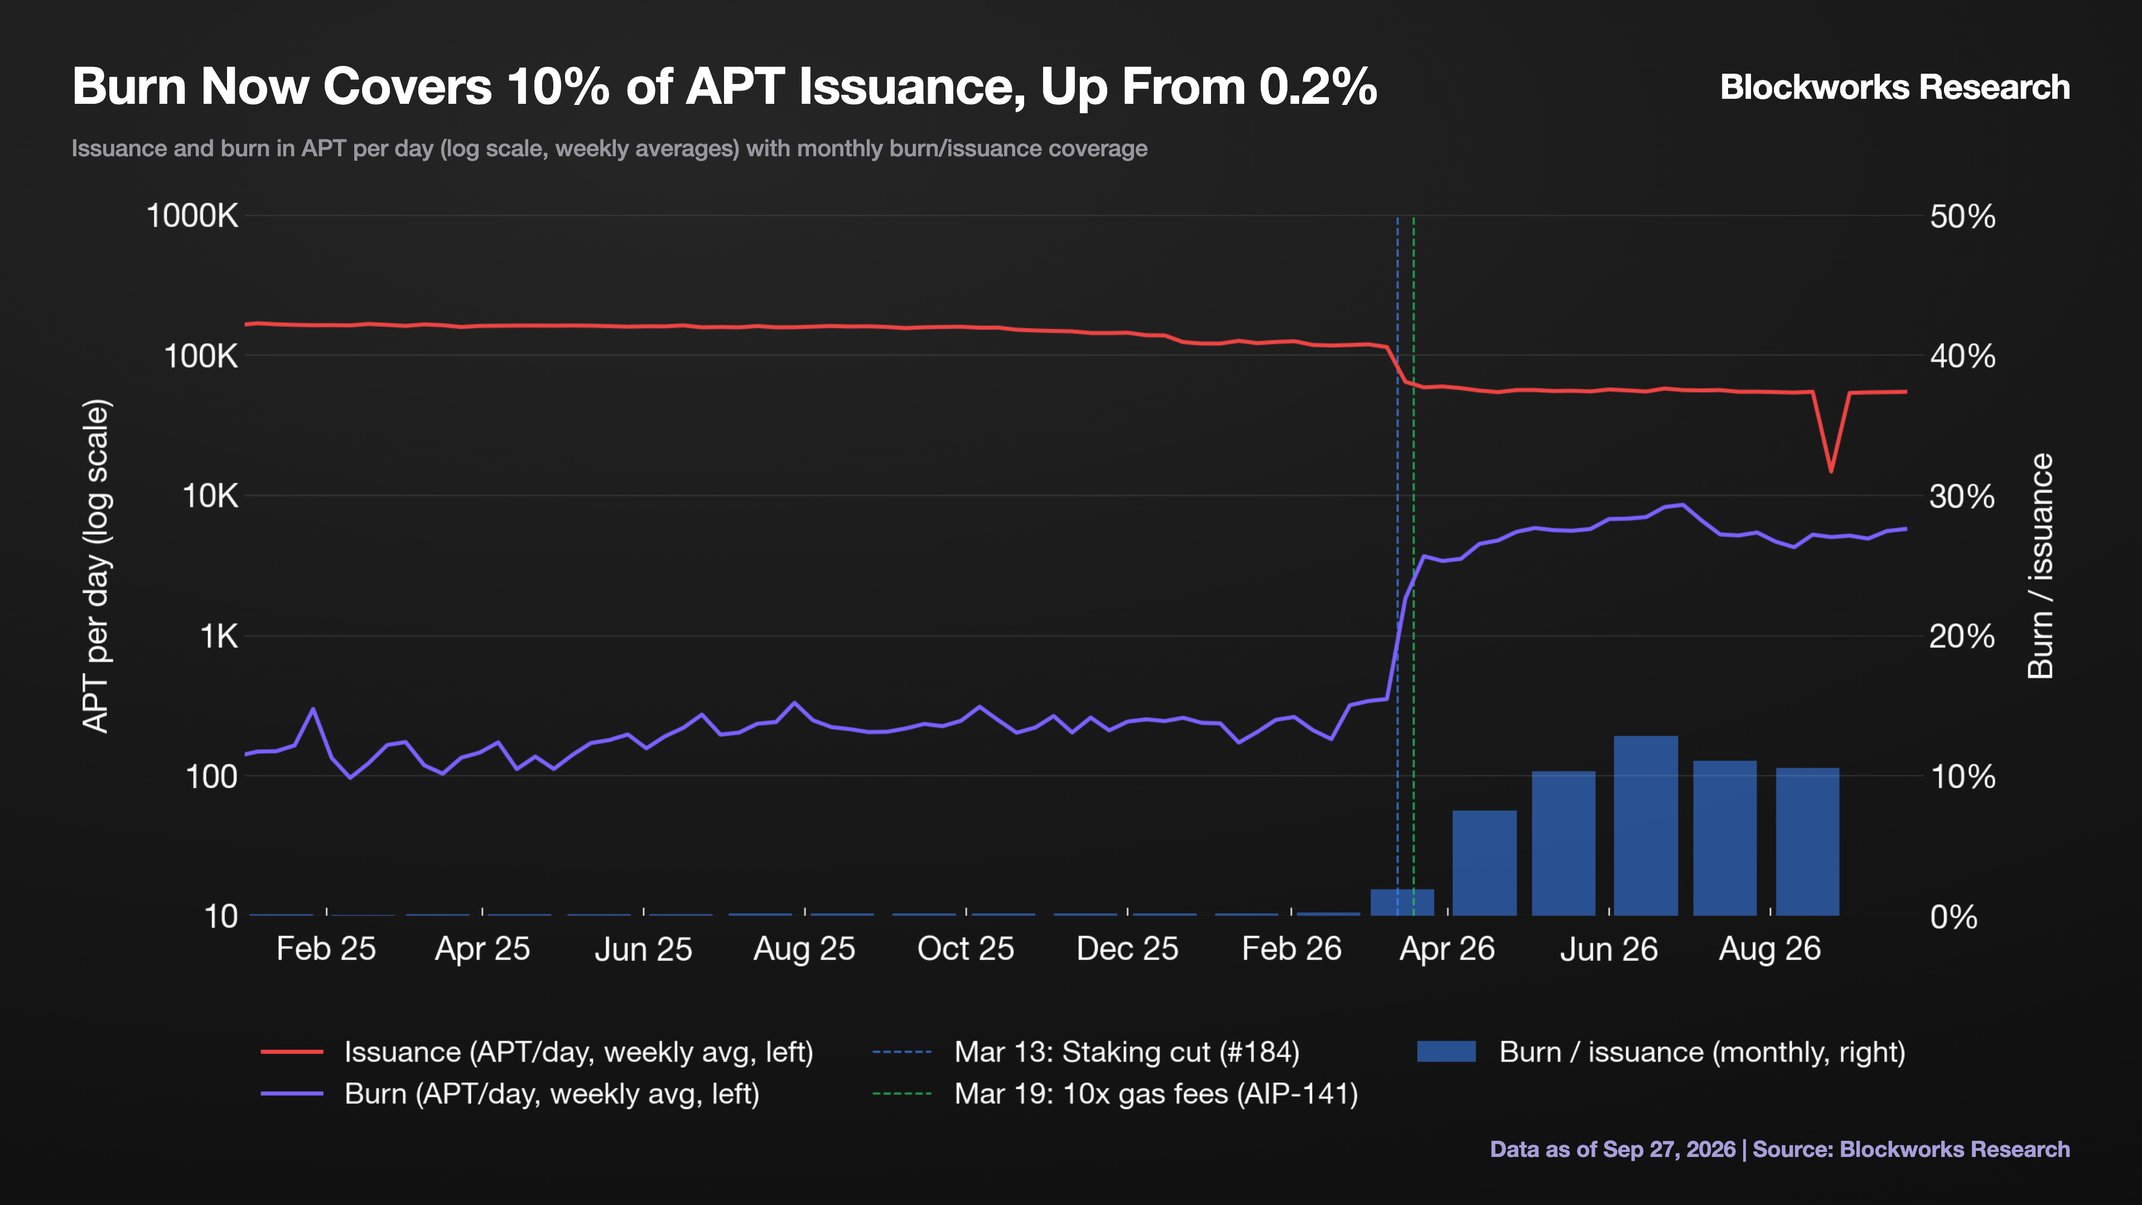
- The increase in gas fees turned a genesis-old design into a value accrual mechanism. Every gas fee has burned since launch, but at old gas prices that covered just 0.2% of emissions, while today it covers ~10%.
- The remaining supply overhang is small and shrinking. Of the 335M APT not yet vested, 210M of Foundation and Community holdings is permanently locked, leaving ~125M to unlock through 2032. Investor and team vesting also ends this October, in aggregate cutting yearly unlock flow from ~135M to ~21M APT (excluding staking issuance).
- Transaction demand grew straight through the increase in gas fees. Daily transaction counts doubled from ~4.5M to ~9M at 10x the old gas fees, led by Decibel's fully onchain perps order book.
The Overhaul
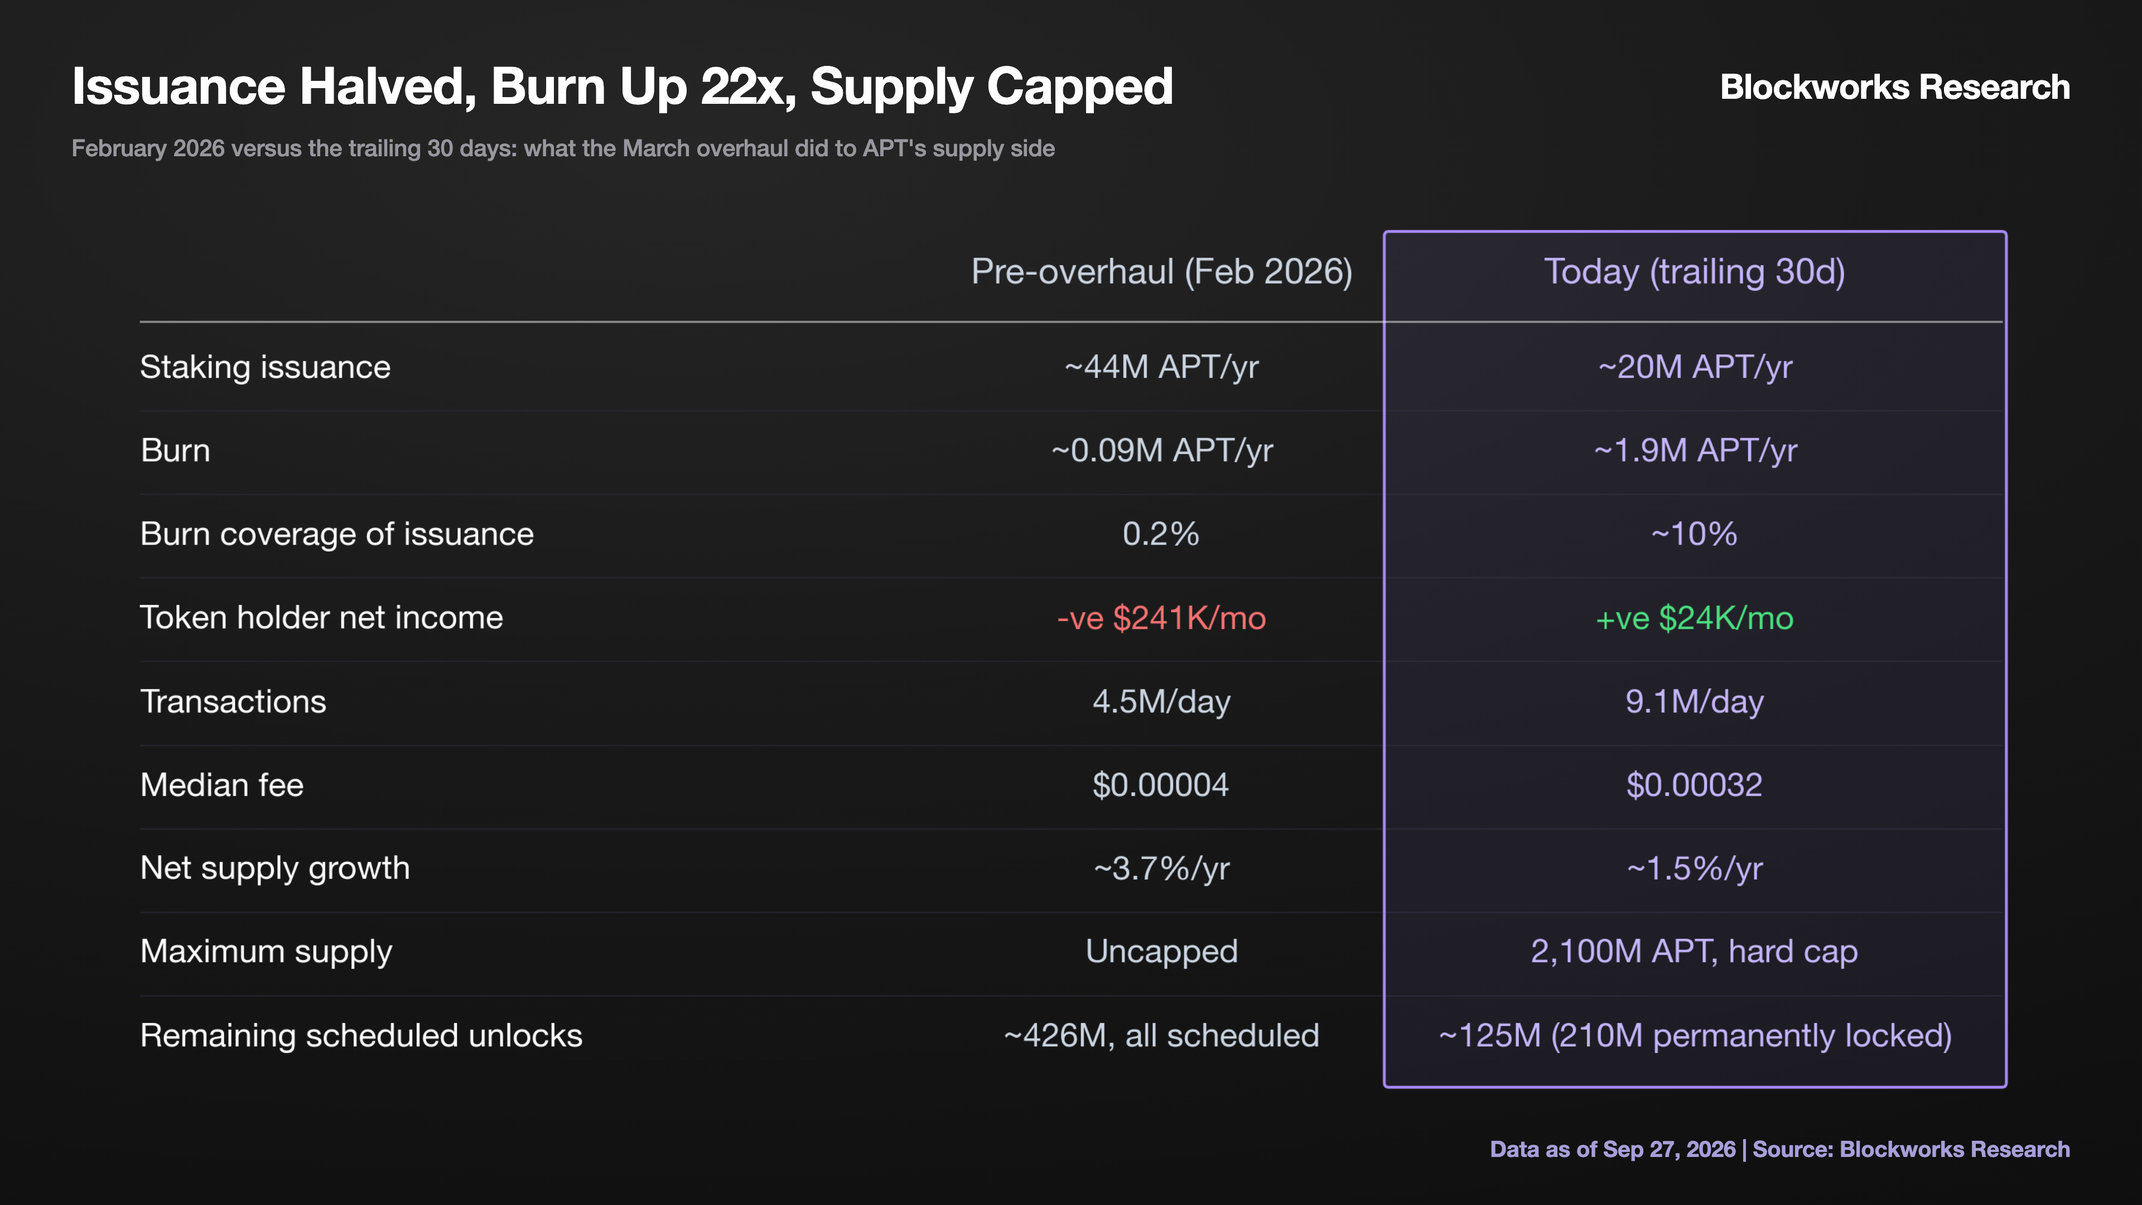
Between February 19 and March 19, 2026, APT's supply model was restructured through four governance changes, and the effect is already visible in the data. Almost every measure of the token's supply picture has since improved, summarized in the table below, among them Token Holder Net Income (THNI) turning positive in May, a result we return to in detail later in the report.
The four key changes include:
- (1) Gas fees increased 10x: Aptos has burned 100% of gas fees since genesis, but at prior pricing the burn was economically negligible. The March repricing raised every fee in the gas schedule 10x, which lifted the realized median transaction fee from ~$0.00004 to ~$0.0003, materially increasing burn per unit of activity while still keeping fees among the lowest of any major chain.
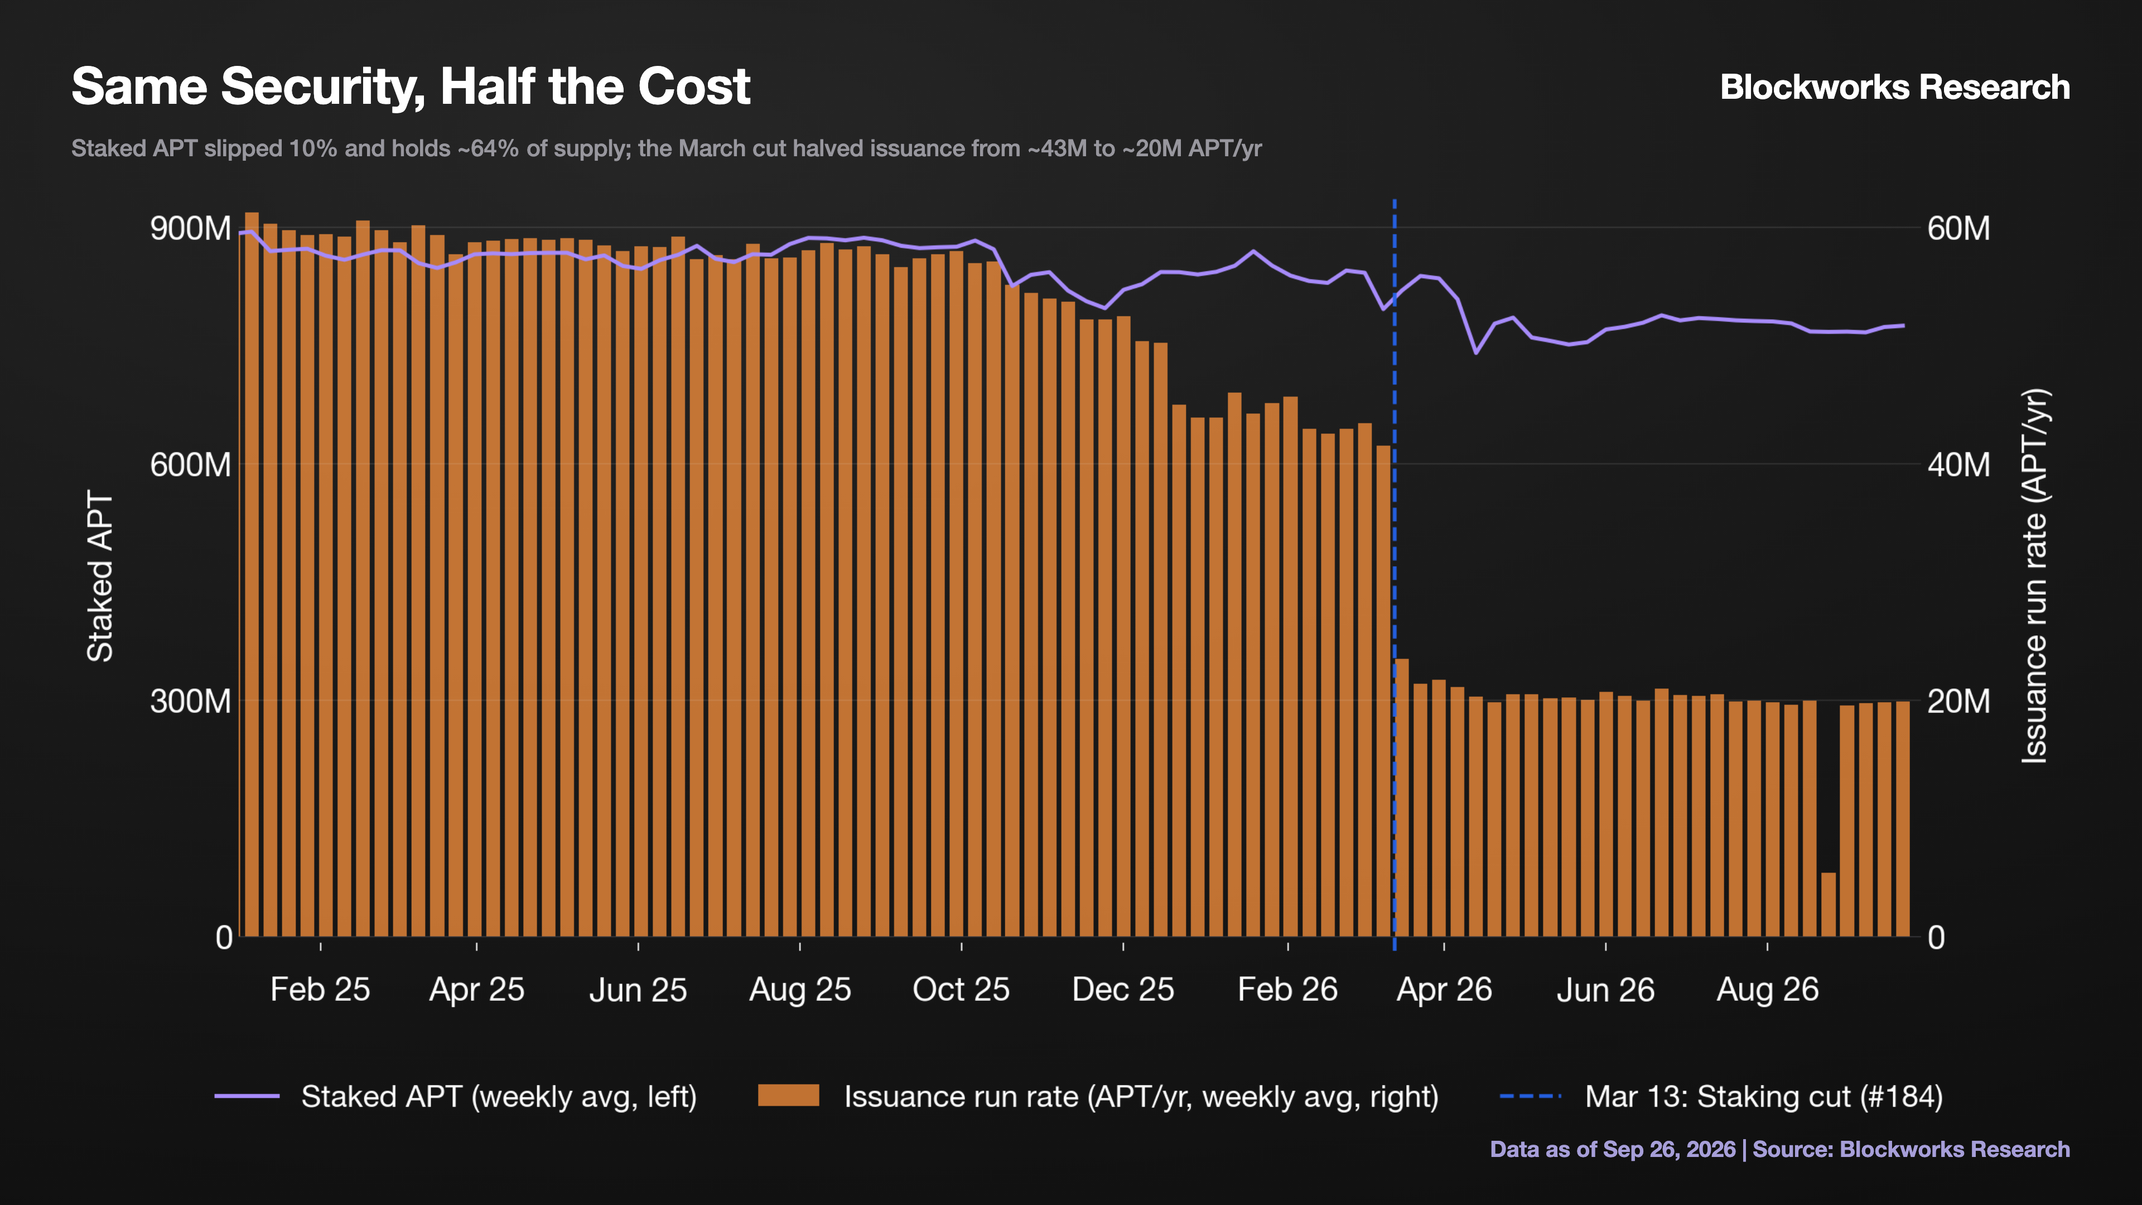
- (2) Staking rewards were halved: The reward rate fell from 5.19% to 2.6%, reducing new issuance proportionally. Emissions now run ~20M APT per year against a staked base of ~773M.
- (3) Supply was capped at 2.1B APT: Total supply is ~1.21B, leaving ~890M, roughly 42% of the cap, as the ceiling on all future issuance, bounding long-run dilution.
- (4) The Foundation locked 210M APT permanently: The tokens are staked for network security and cannot be sold or distributed, removing roughly 17% of current total supply.
The result has been a step change in potential value accrual: the network now runs on half the issuance while activity burns supply against a hard cap.
All of it went through onchain governance in under three weeks. The Aptos Foundation initiated the three proposals, and tokenholders approved them in sequence: the supply cap and Foundation lock (#183) on March 1, the staking reduction (#184) on March 13, and the gas repricing (#185) on March 19.
Throughput Is the Asset
The March change repriced an existing mechanism rather than introducing a new one. Every gas fee has burned since mainnet launch in October 2022. March simply made the flow matter with fees up 10x and issuance cut in half.
AIP-141 raised every cost in the gas schedule by the same factor of 10. Gas is a meter of the work the network does for a transaction and octas are the APT you pay for it (1 APT = 10⁸ octas).
fee per transaction ($) = (execution + IO + storage gas, in octas) × schedule multiplier × APT price ÷ 10⁸
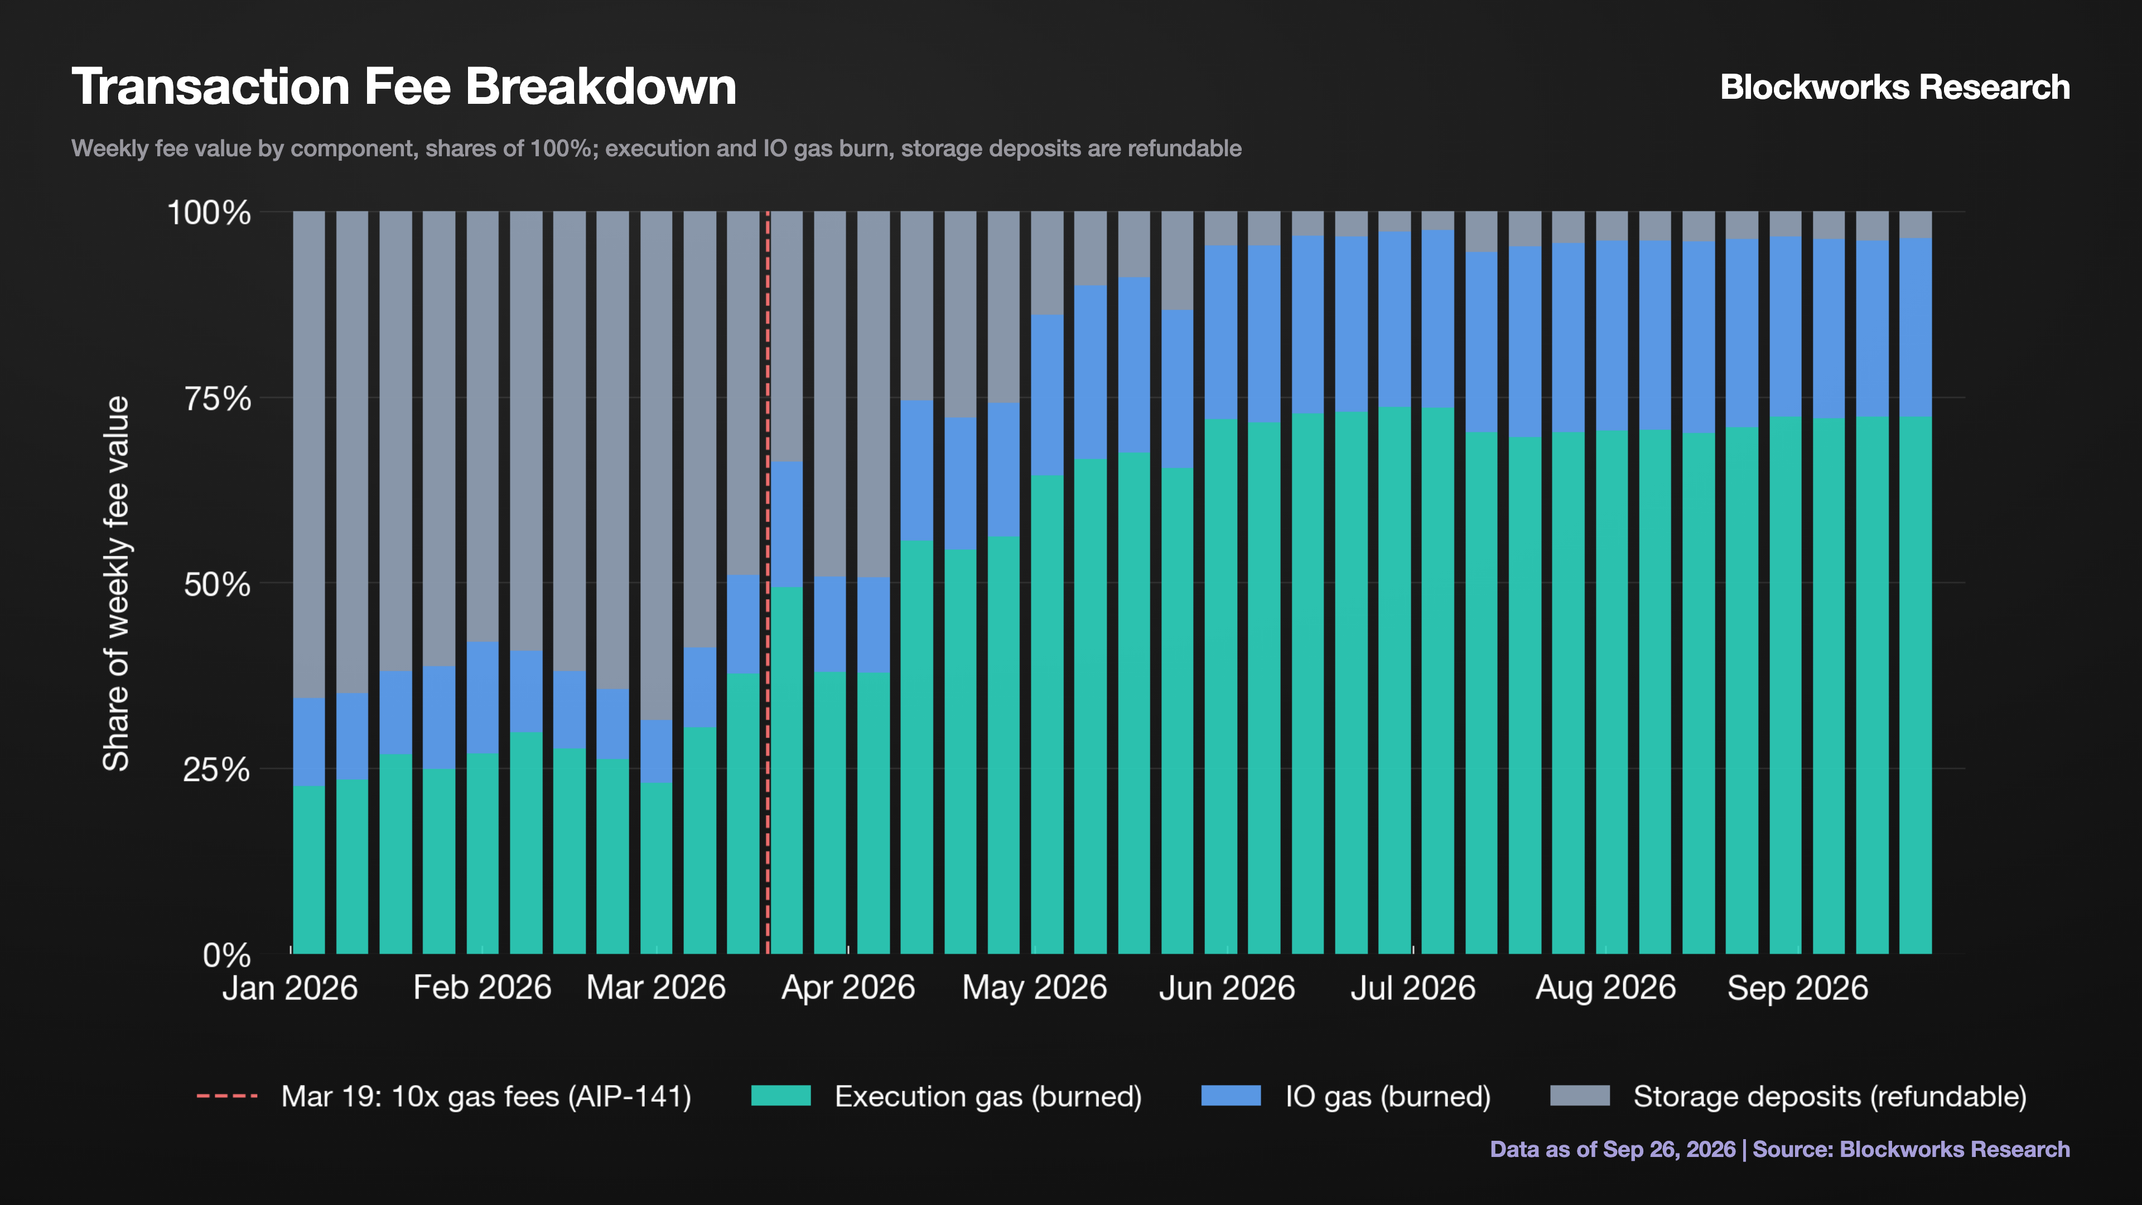
- Execution gas = compute. This pays for running the Move code itself, the arithmetic, logic, and function calls behind a transaction, essentially CPU time.
- IO gas = access. This is charged for every state slot a transaction reads, such as a balance, a pool's reserves, or an oracle price, and for every existing slot it updates, with those writes then propagated across the network. It prices touching data that is already there.
- Storage fees = persistence. These apply to the state a transaction leaves behind, which the network must hold indefinitely: a new account, a new token balance, or a new position object.
Essentially, execution and IO pay for work done once, so they are burned; storage pays for data held over time, so it is taken as a deposit and returned if the state is later deleted. The chart below shows the mix shifting from mostly storage deposits in January to mostly burned gas today, a change we return to later in the report.
Through early 2026, the median transaction cost ~$0.00004 and daily burn averaged ~$242, about 0.2% of daily issuance. At that level the burn had no measurable effect on net supply, so throughput growth, Aptos's core technical strength, contributed little to token economics.
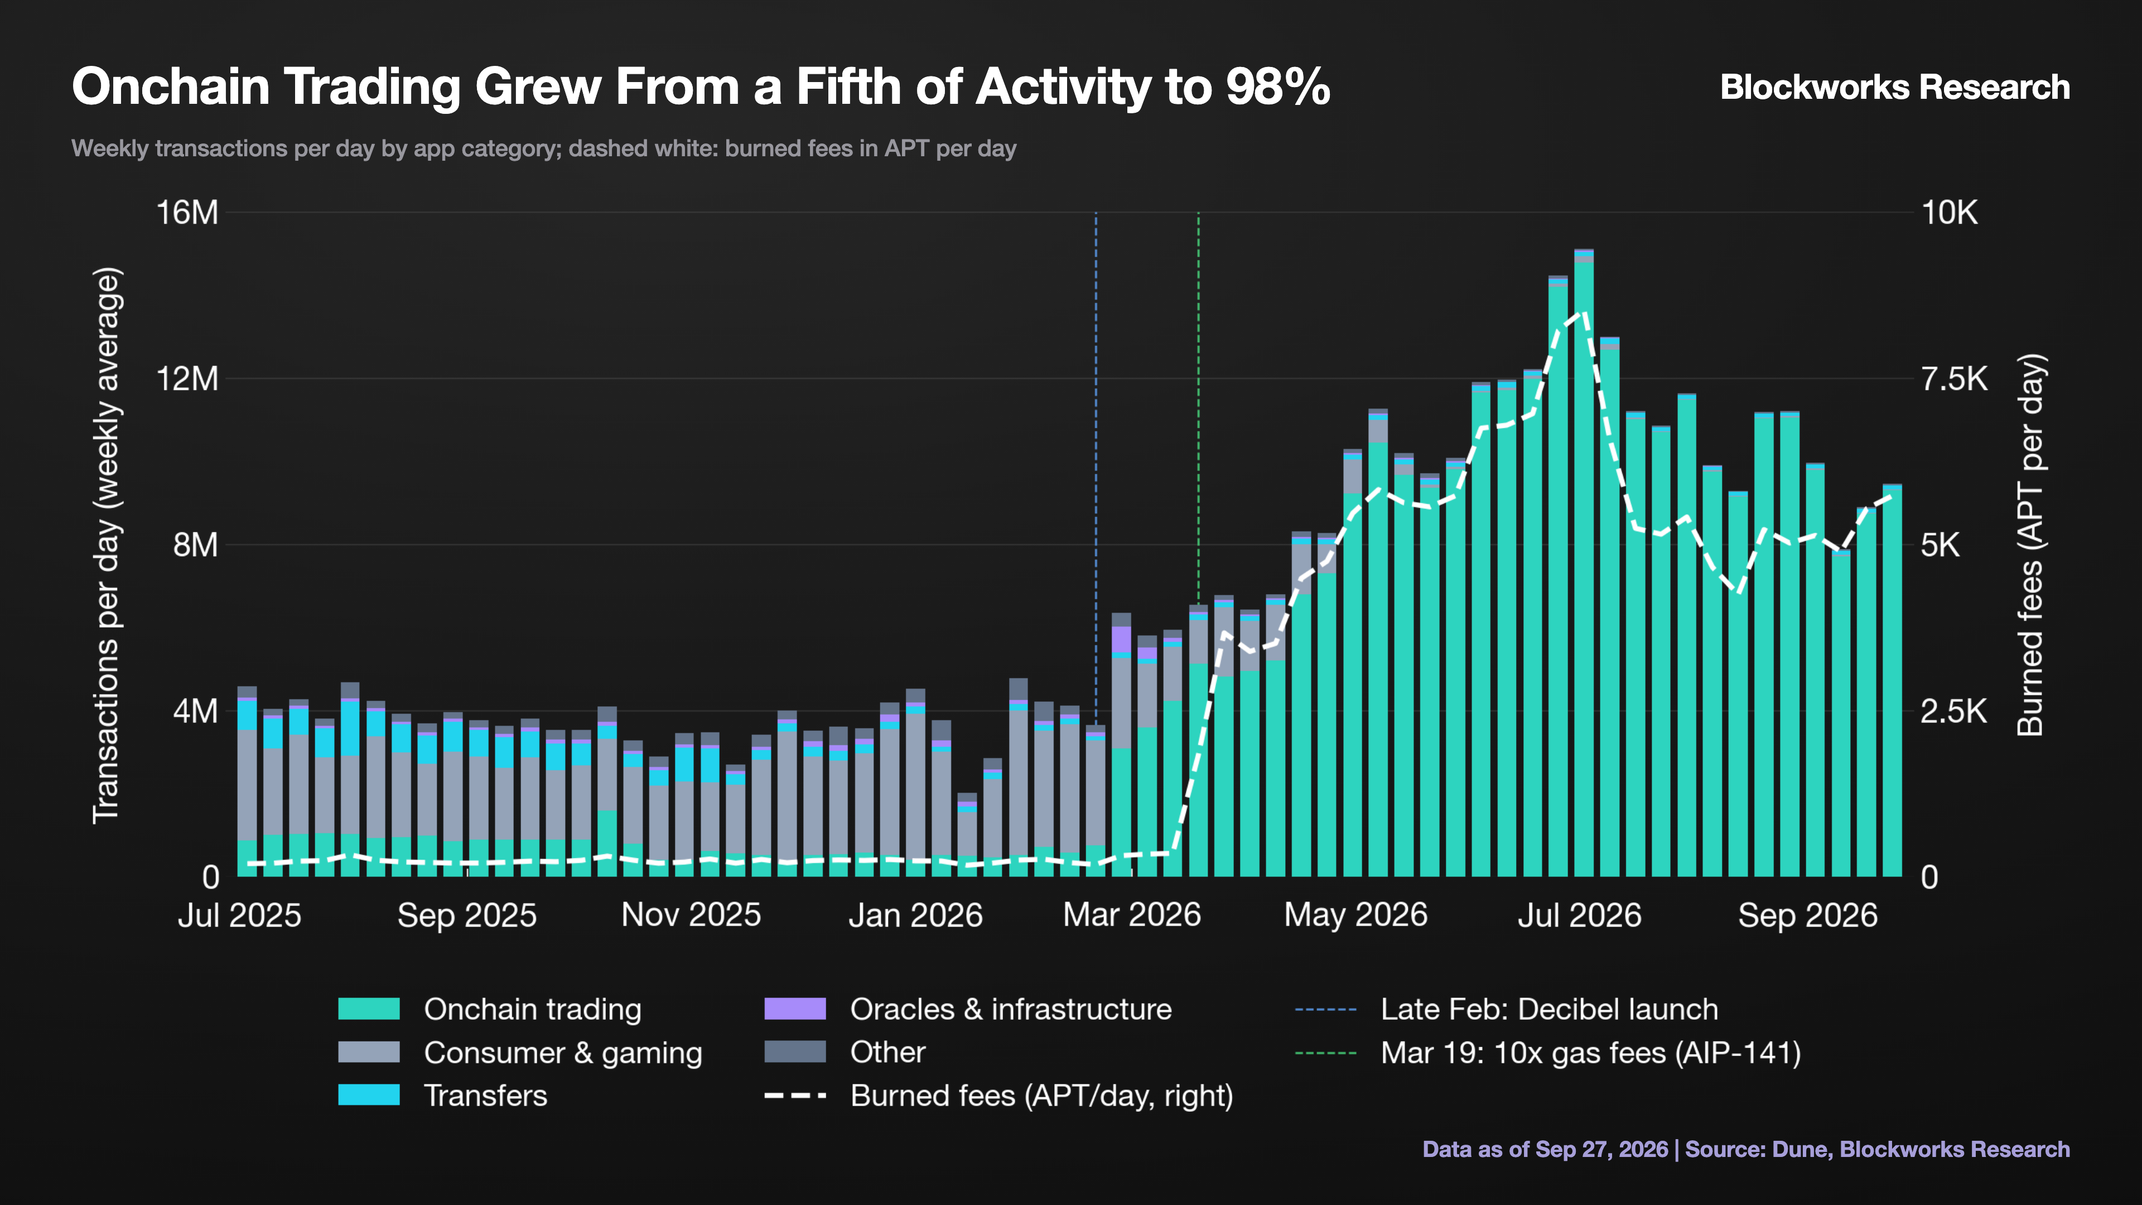
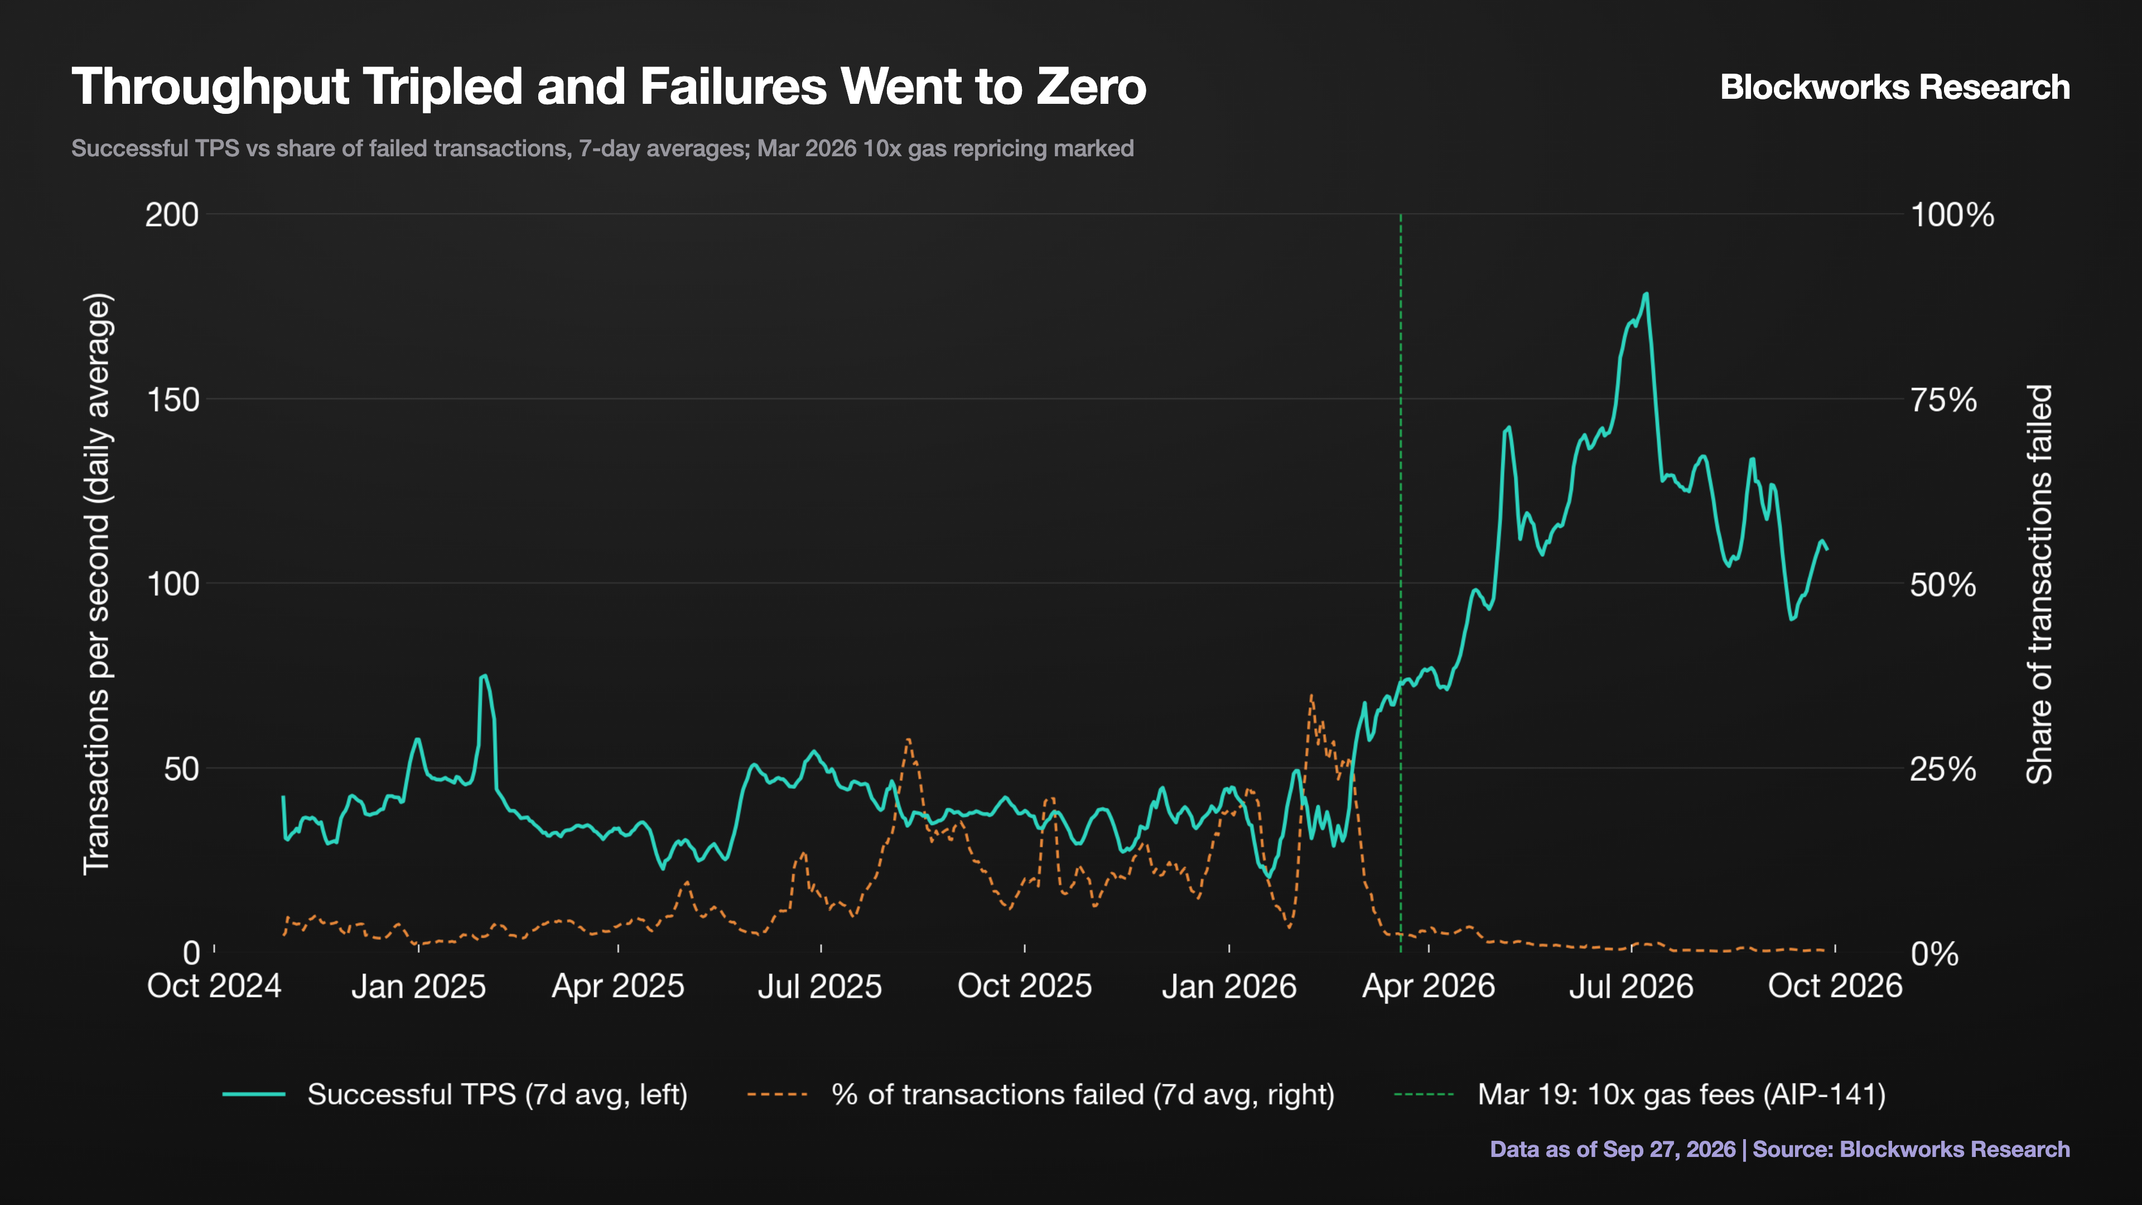
The obvious objection to a 10x fee increase is its effect on activity, and the opposite happened: transactions rose from roughly 4.5M per day in February to more than 12M by June, easing to ~9M in September, still double the February level. Fees started so low that ten times more is still trivial, with the median transaction costing about $0.0003 even after the repricing.
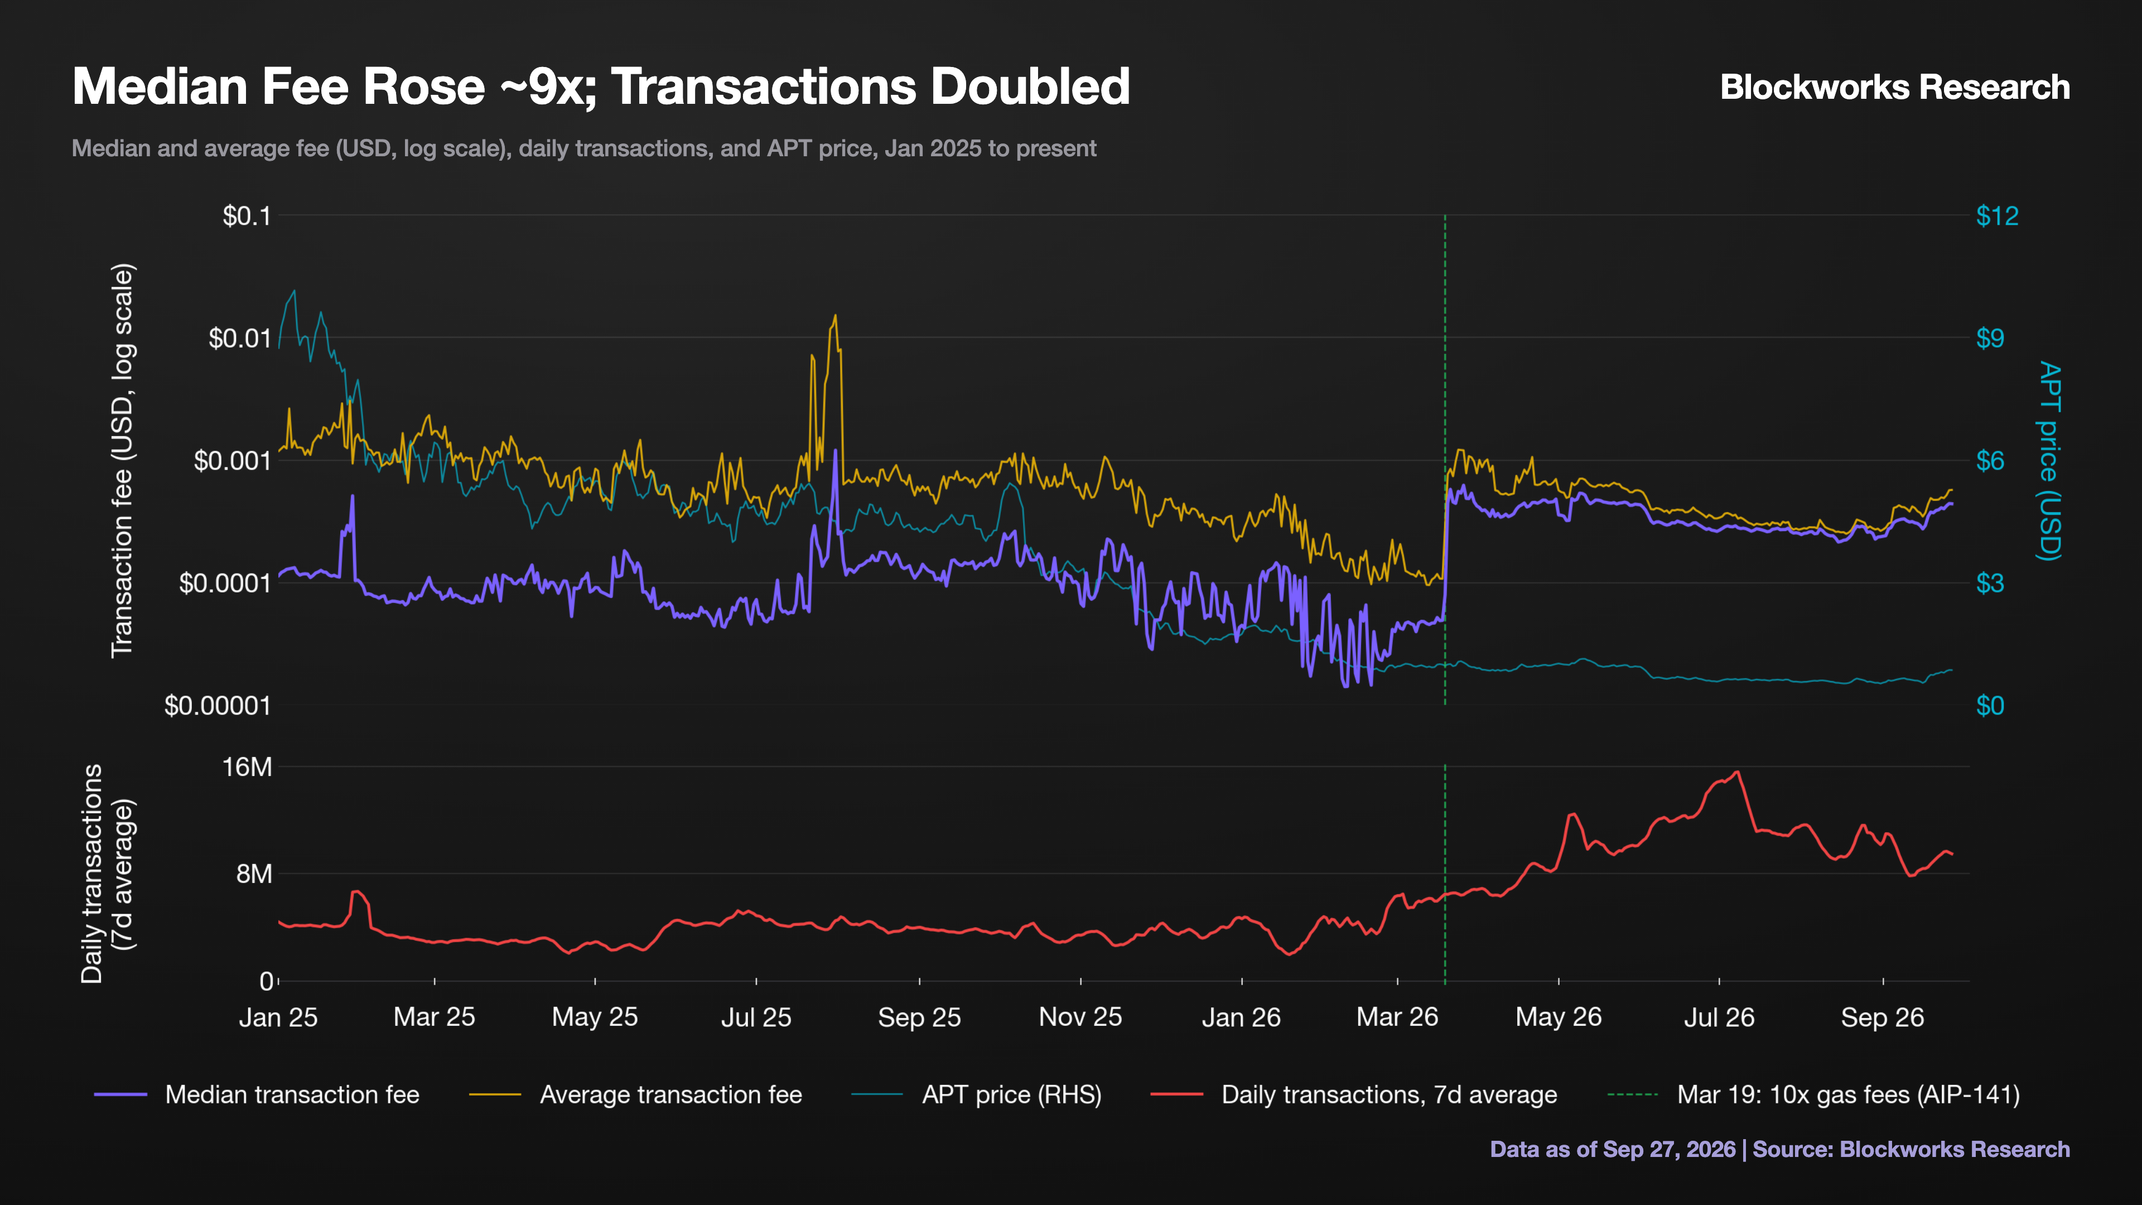
Although we cannot determine what activity would be like today without the gas price increase, it is fair to say that activity growing significantly at 10x the prior fee level indicates current gas pricing sits well below users' sensitivity threshold.
Over the trailing 30 days, daily burn averaged ~$3,500, a 14x increase, and covered roughly 10% of daily issuance, up from 0.2% in February. However, the coverage gain comes from both sides of the ratio, with daily issuance's dollar value falling ~3.6x, roughly half from the March staking cut and the rest from APT's lower price.
Issuance: Halved and Capped
New APT is created only through staking rewards. Every epoch, validators and their delegators receive a governance-set rate on the APT they have staked, so total issuance is the reward rate applied to the staked base. At the post-overhaul rate of 2.6%, that is roughly 20M APT per year on the ~773M staked today, adding about 1.7% to the 1.21B total supply annually before burn.
The rate has been tightened three times. The original schedule (AIP-30) declined by 1.5% of its level each year from 7% at genesis; AIP-119 accelerated that with monthly cuts through late 2025, landing at 5.19%; and Proposal #184 completed the arc, halving it to 2.6% and setting the on-chain minimum to the same level, so the rate is now flat until governance votes again.
Each staker receives the same 2.6% regardless of how many others participate, so total issuance moves with the staked base. Until March, that growth was unbounded; APT launched with 1B tokens in October 2022 and had compounded to ~1.21B with no ceiling.
Proposal #183 introduced the first ceiling: a hard cap of 2.1B APT on how many tokens can ever exist. If the burn grows to destroy more APT than staking creates, supply falls and the ceiling never comes into play; if not, supply eventually reaches 2.1B and no more can be created. Either way, emissions are now finite where before March they were unbounded.
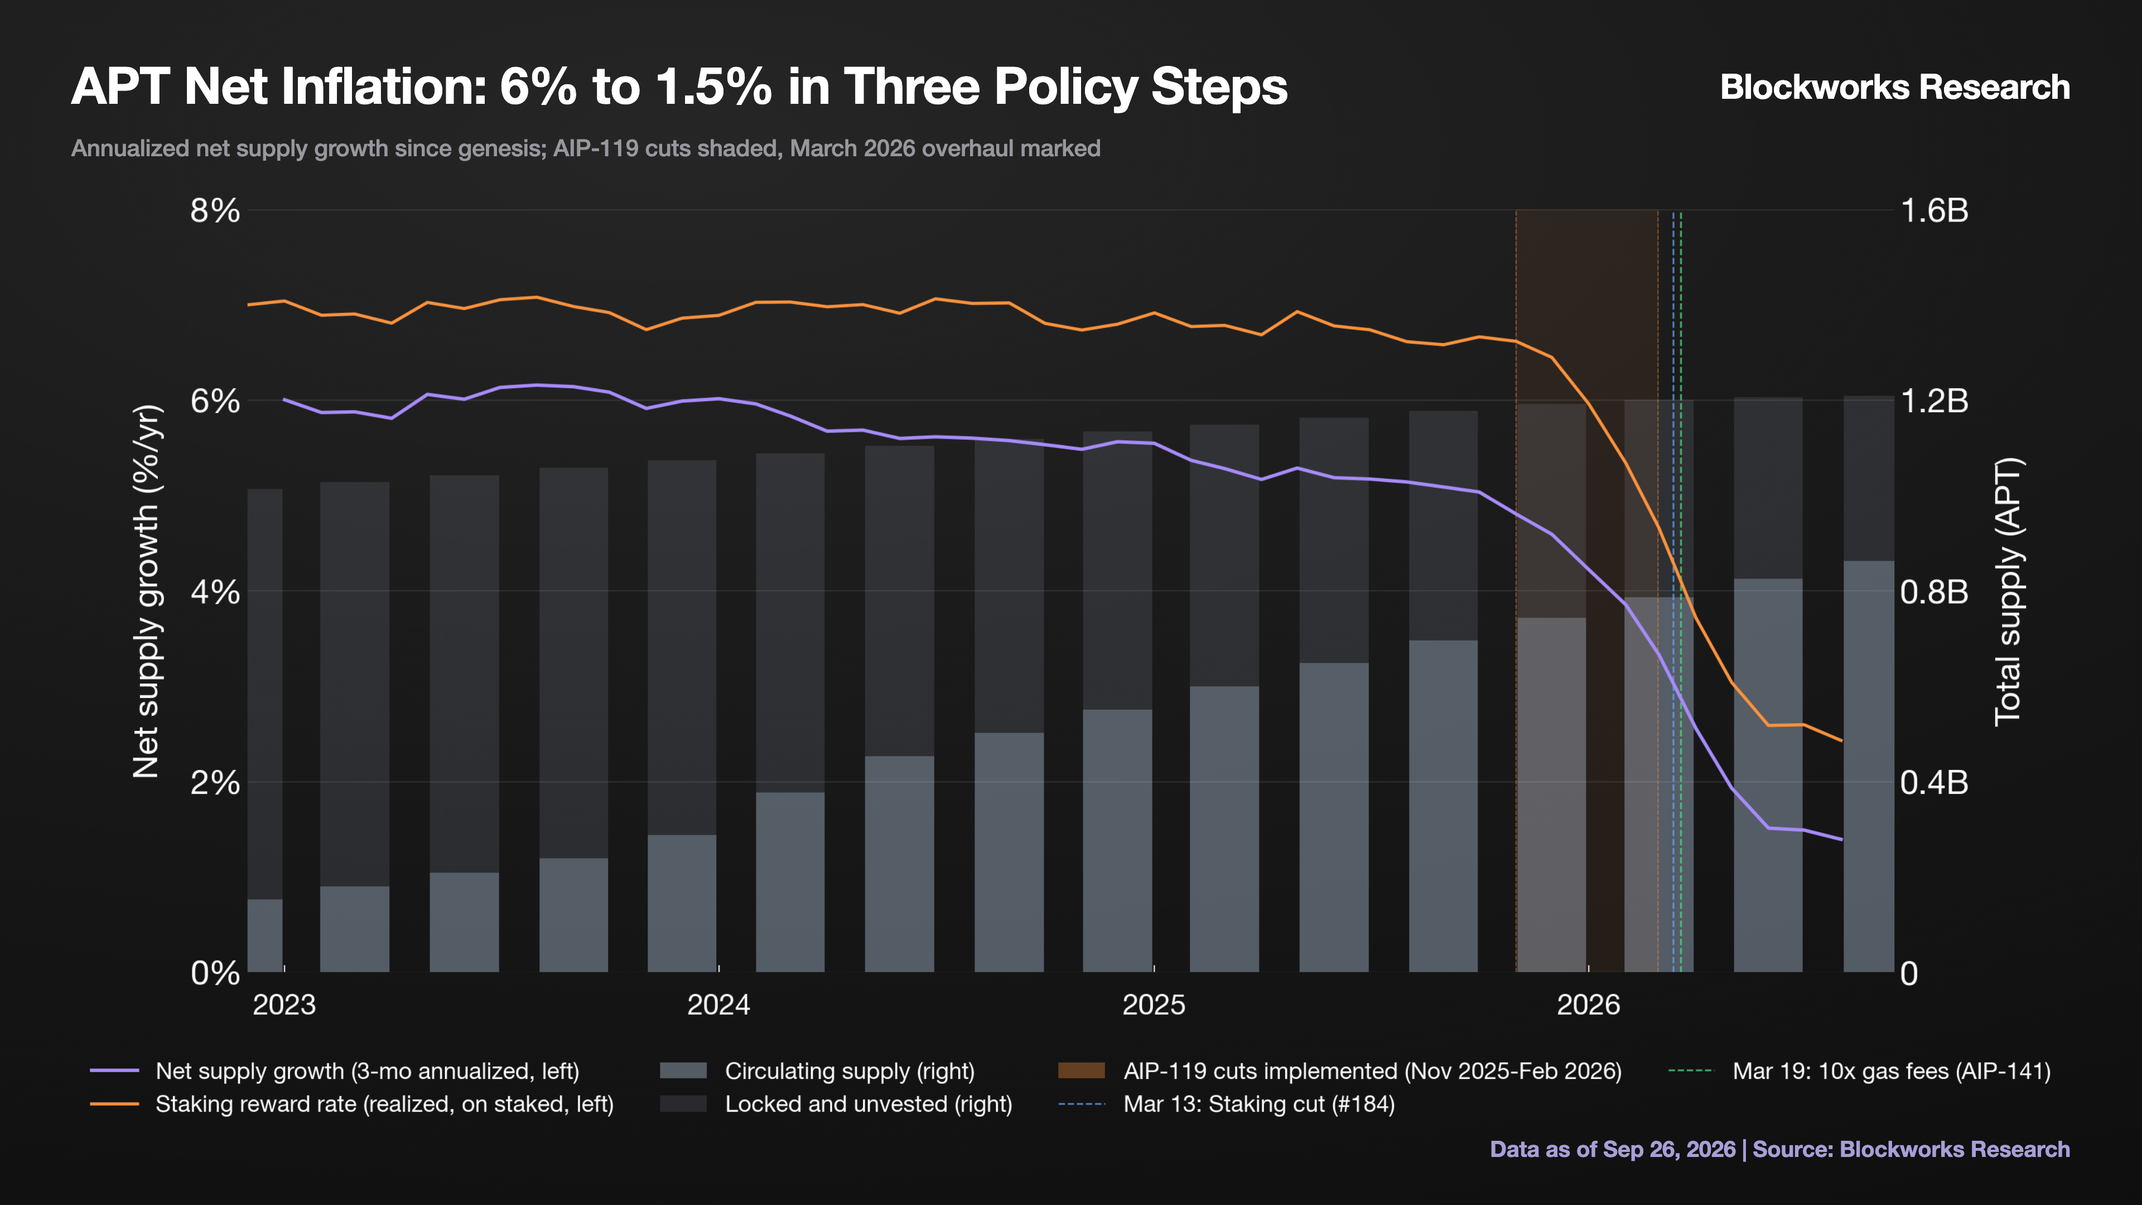
Staking rewards are technically just a redistribution from non-stakers to stakers, but they arrive as freshly minted APT, and rewards get sold at a far higher rate than idle holdings as validators cover costs and funds harvest yield. The cut halved that flow, with issuance falling from ~43M to ~20M APT per year.
Security is the natural question for a halved reward rate, and the data largely puts it to rest. Staked APT is down only ~10% from its February level, ~64% of supply remains staked, among the highest ratios of any major L1, and what consolidation did occur was concentrated among marginal operators. Therefore, the network is buying almost the same security for half the issuance.
The forward path helps too. AIP-139 cuts the cost of running a node, improving operator margins at the lower rate, and the duration-weighted staking framework under exploration would pay long-term stake relatively more within the same emissions budget. Hence, security spending is getting cheaper and better targeted, not just cut.
Token Holder Net Income
So what does all of this mean for the network? The answer nets out in one measure: Token Holder Net Income (THNI).
THNI is a Blockworks Research metric, applied identically to every L1 we cover. It is not a metric designed, endorsed, or officially recognized by the Aptos Foundation. THNI is the network's Real Economic Value (REV) minus operator payments. REV is the fee value the network captures, whether burned or paid out. Operator payments are the value that leaves the holder base to validators, builders and other operators. Token holders are the aggregate of stakers and non-stakers, so staking rewards paid to delegators are a redistribution within the holder base, not an expense. On Aptos, revenue is the burn, accruing to every holder as supply reduction, and the expense is validator commission, the share of staking issuance that operators keep.
THNI works as both a value-accrual proxy and a health test, positive only when real usage generates more value than the network pays its operators. The overhaul moved both lines at once, the gas repricing multiplied revenue and therefore the burn, while halving issuance roughly halved the commission (~19% stake-weighted) flowing to operators. As a result, THNI turned positive in May 2026 and has held since.
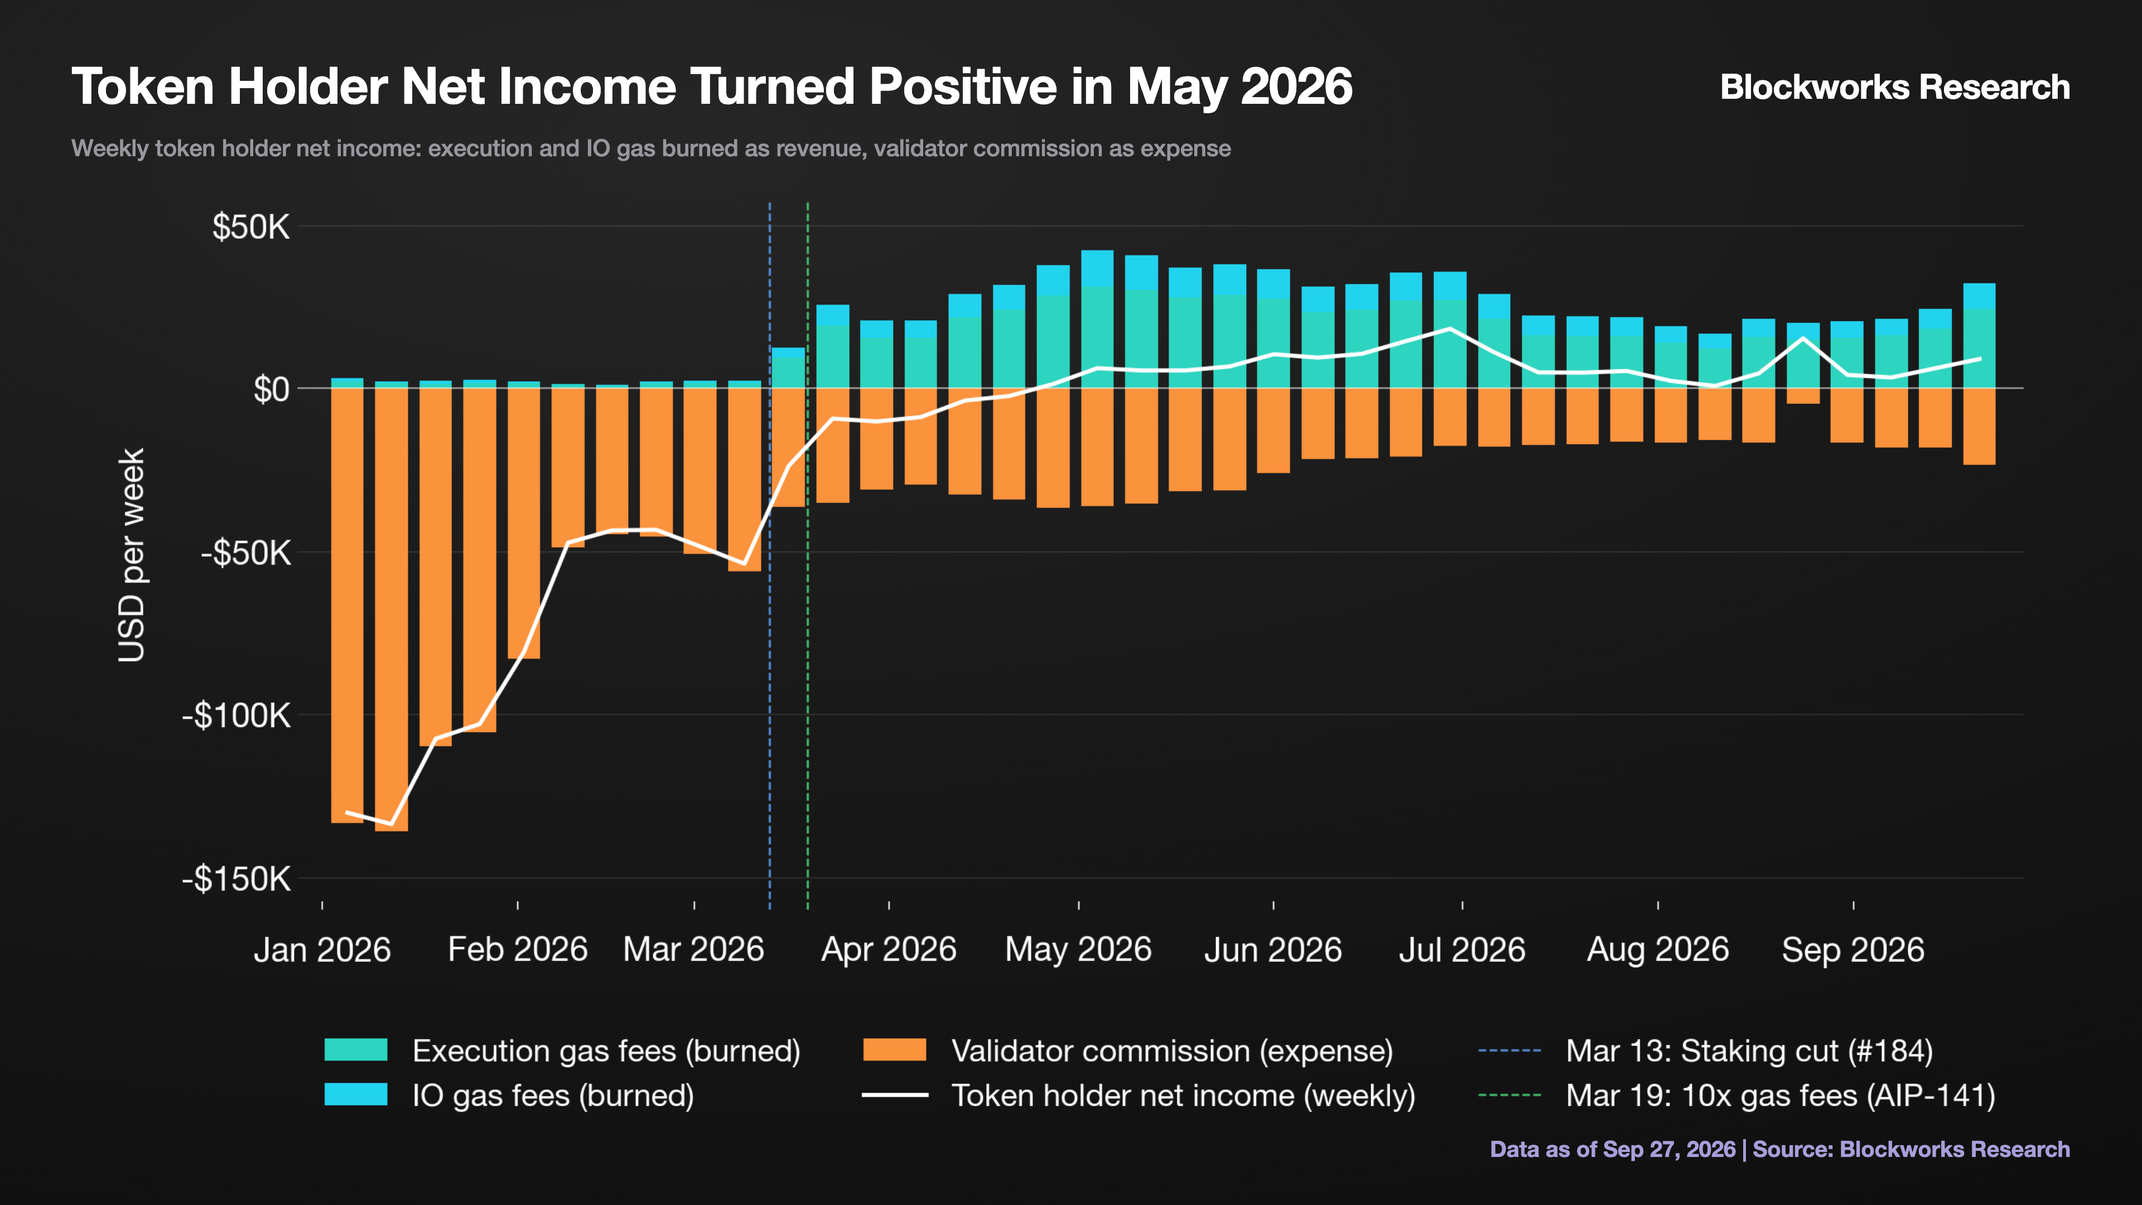
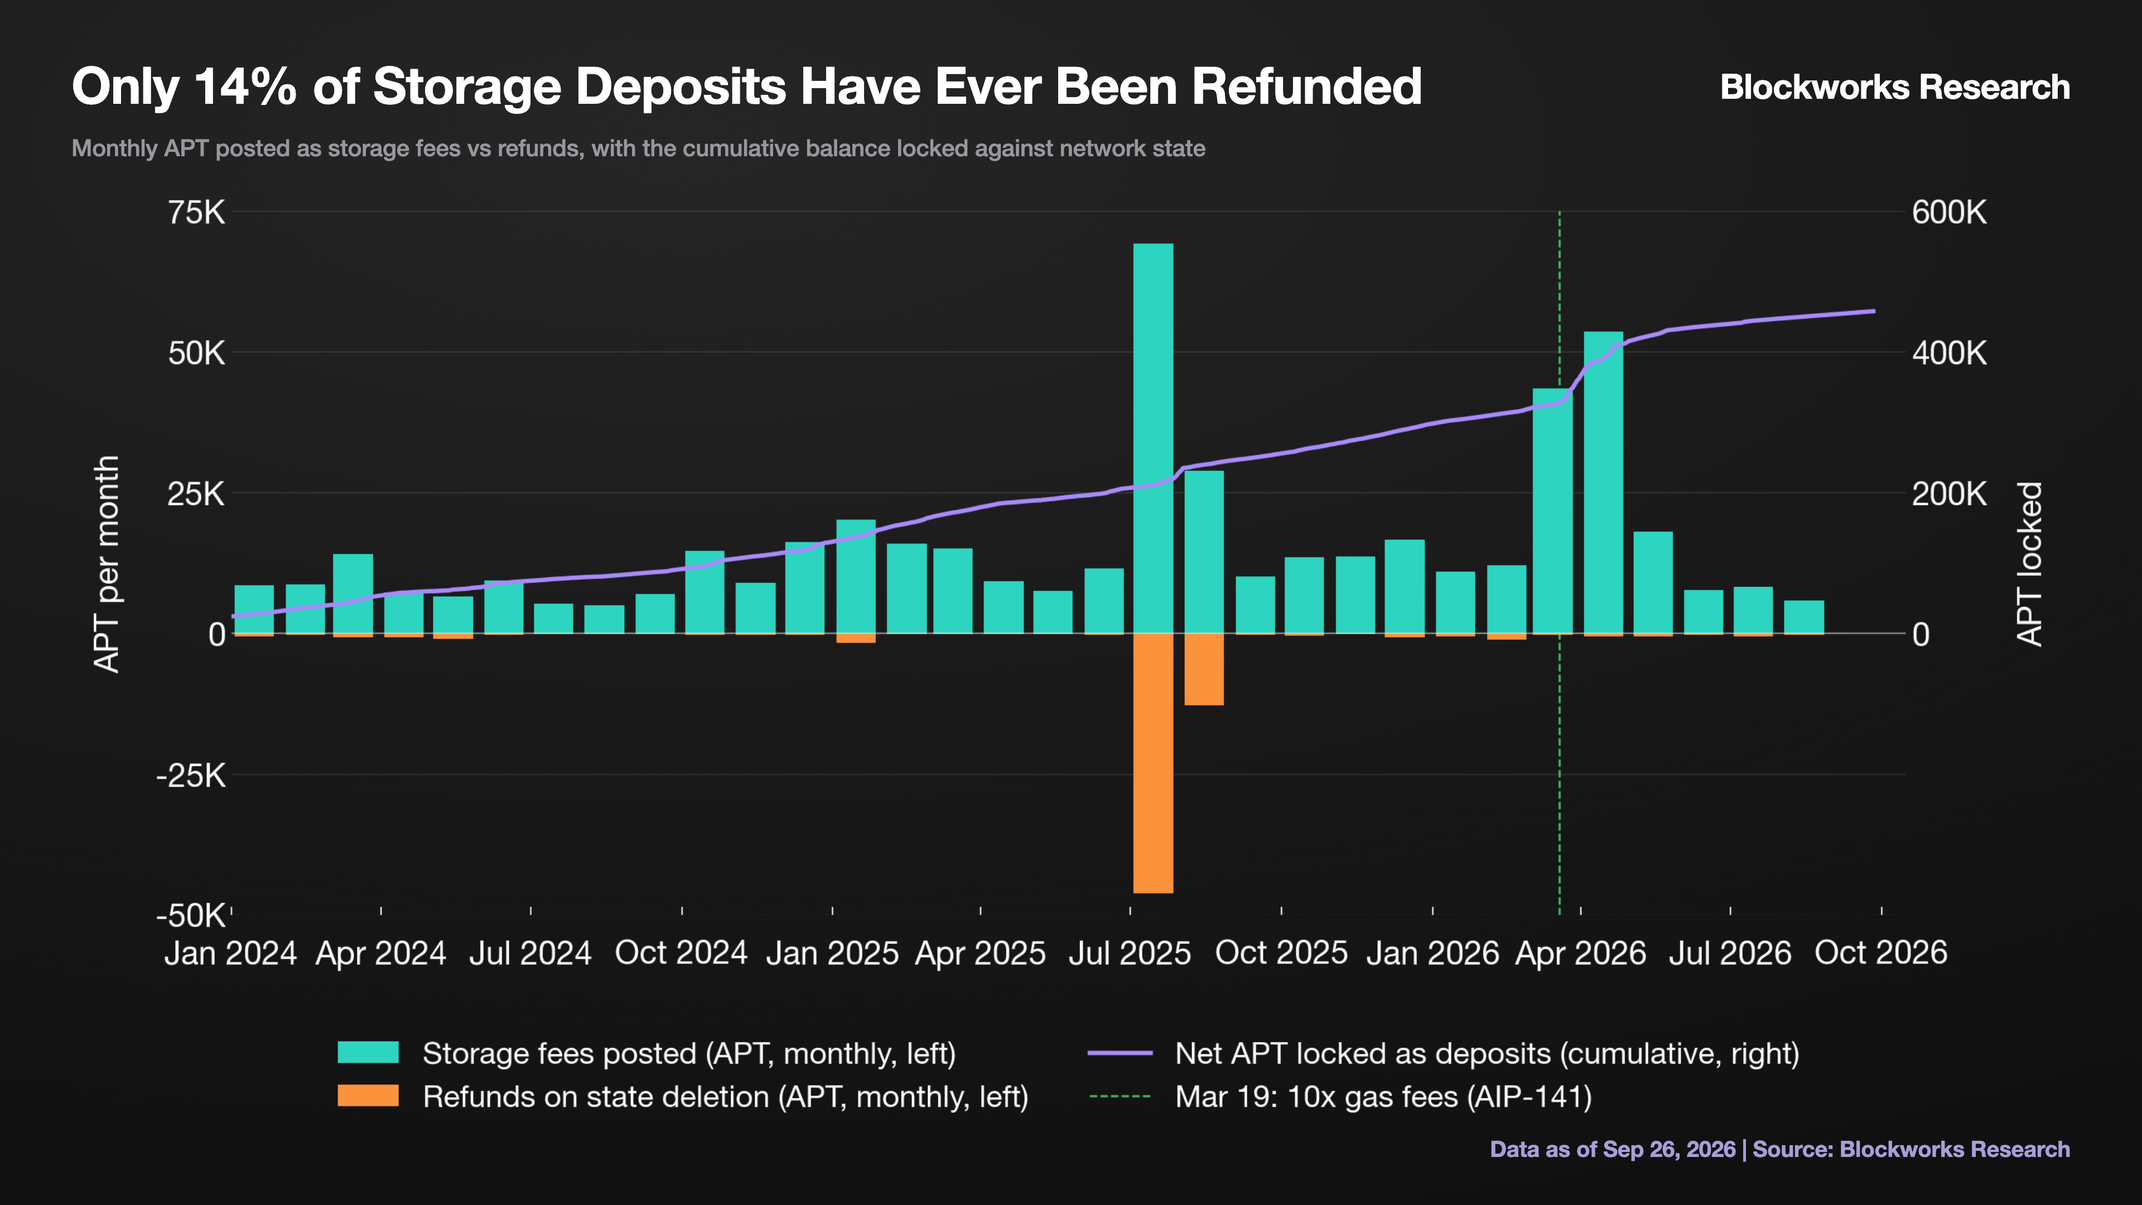
Note that storage fees sit outside this statement entirely. On Aptos, a transaction that expands the network's state, such as a first-time account, a new balance, or a mint, posts a storage fee sized to the bytes it adds. Because the payer can reclaim the fee by deleting that state, it is a deposit rather than income, so it is excluded from REV and THNI.
However, in practice the storage costs rarely move again. Of the roughly 530K APT posted as storage deposits since genesis, only 14% has ever been refunded, leaving about 457K APT locked against the network's state, a second, quasi-permanent supply sink that grows with usage.
Storage deposits are an often overlooked mechanism that turns growth itself into locked supply, with every new account and position locking a little more APT. A small piece of the supply picture today that could compound into a larger one as the network scales.
The Supply Math
With issuance halved, security holding, and the cap in place, the remaining supply questions are about tokens that already exist: how much has been released, what is permanently locked, and what is still scheduled to unlock?
Total supply today is roughly 1,210M APT: 1,000M minted at genesis, plus 211M of staking rewards since, minus roughly 1.2M burned. About 874M has been released and circulates. The remaining ~335M, nearly all of it foundation and community allocations, was originally scheduled to vest in full through October 2032.
Under Proposal #183, the same March 1 vote that set the supply cap, 210M APT of the Community and Foundation's holdings, roughly 17% of total supply, was permanently staked; the locked tokens cannot be sold, transferred, or unstaked.
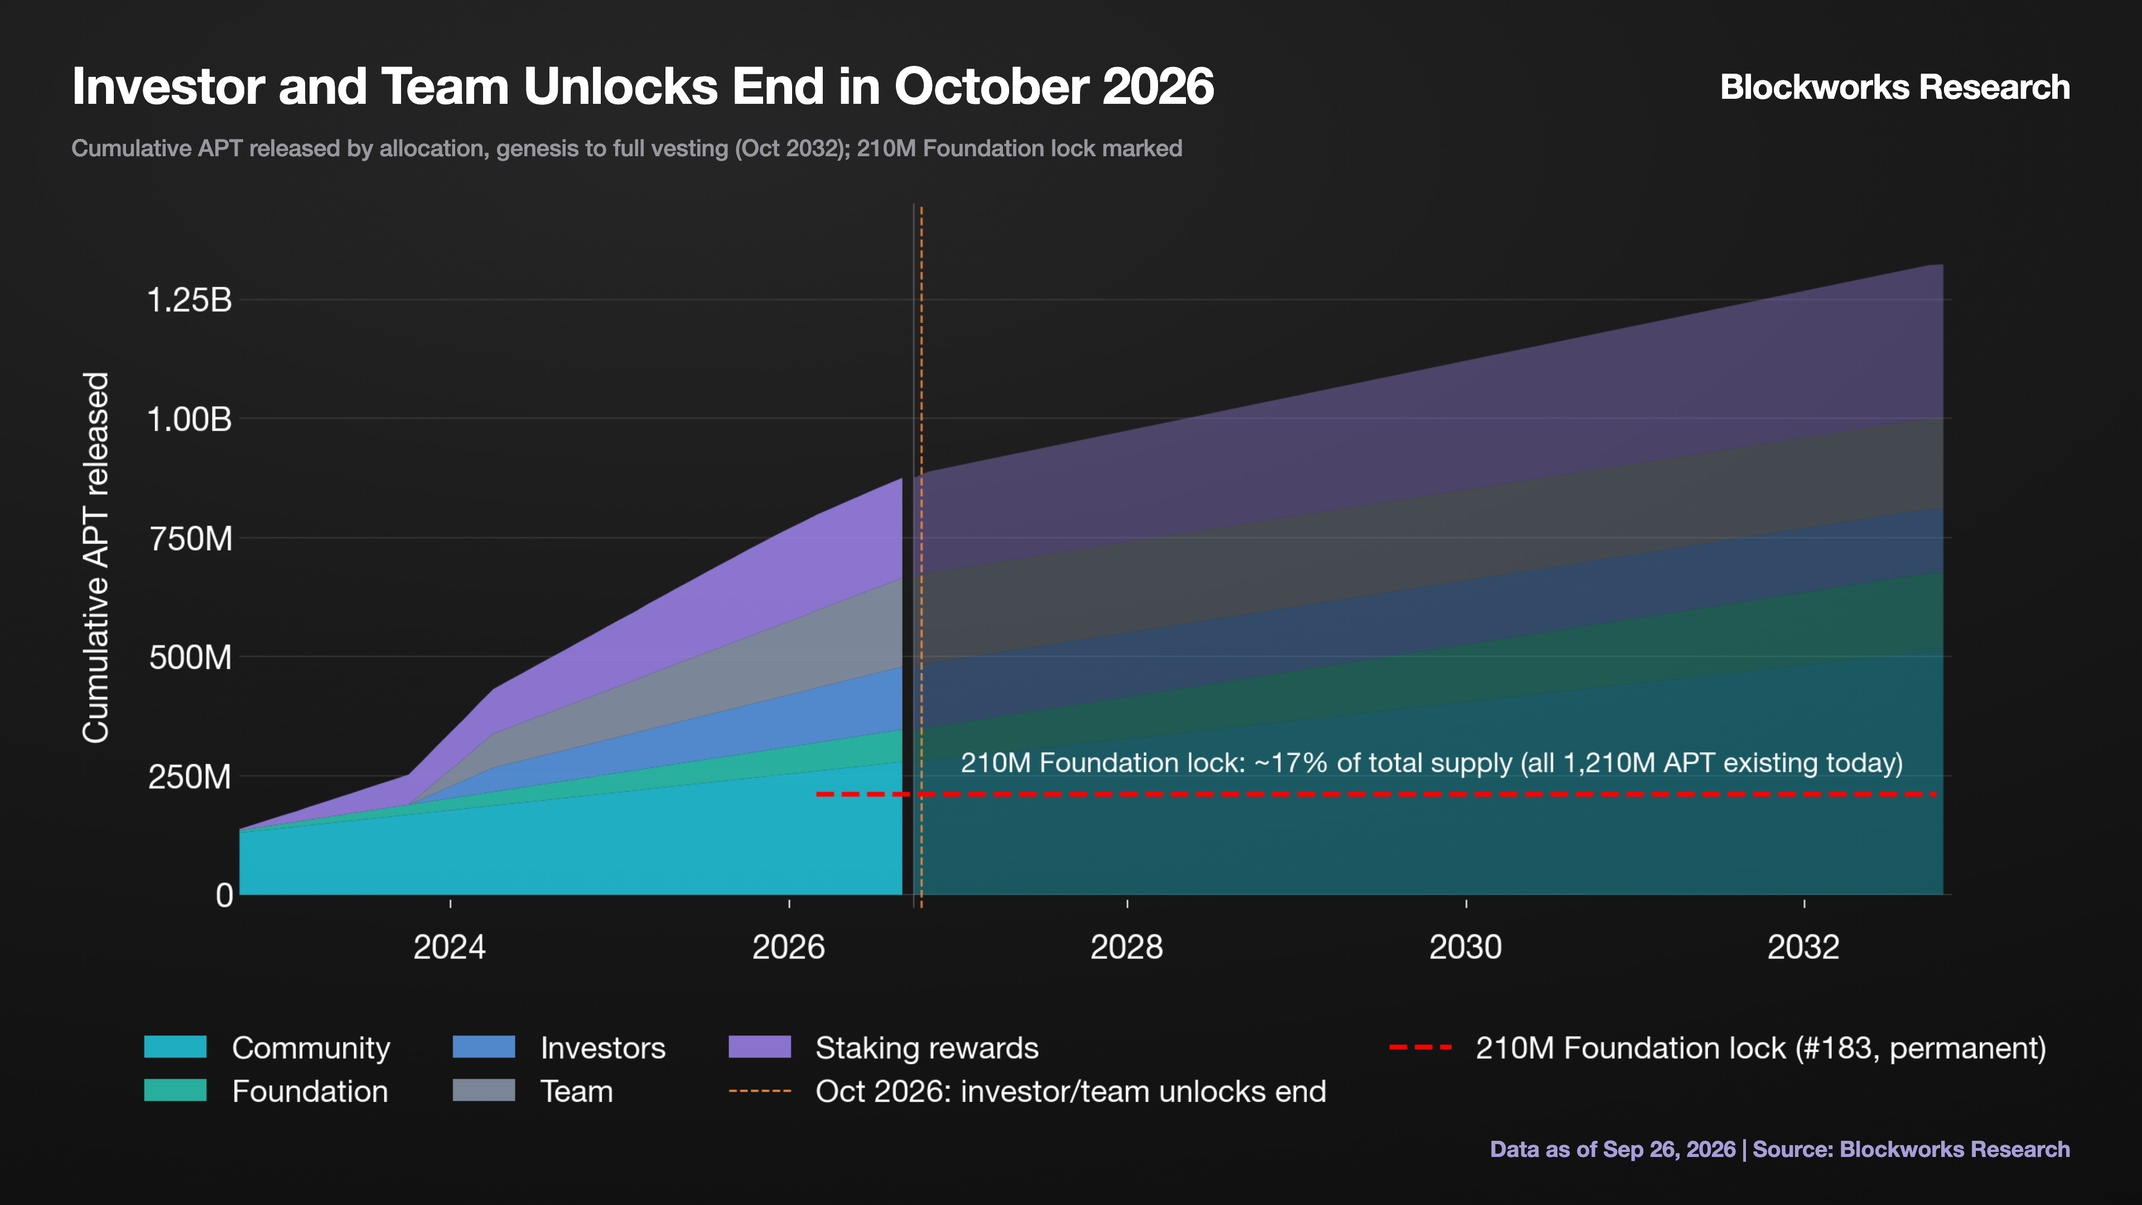
The table below draws the supply structure to proportion, from the 2,100M cap down to the lock. Of the 335M not yet vested, 210M is the permanent lock, leaving ~125M to unlock through October 2032. Investor and team vesting ends this October, cutting total unlocks from ~135M APT this year to ~21M per year of just foundation and community tranches, with ~20M of staking issuance continuing separately on top.
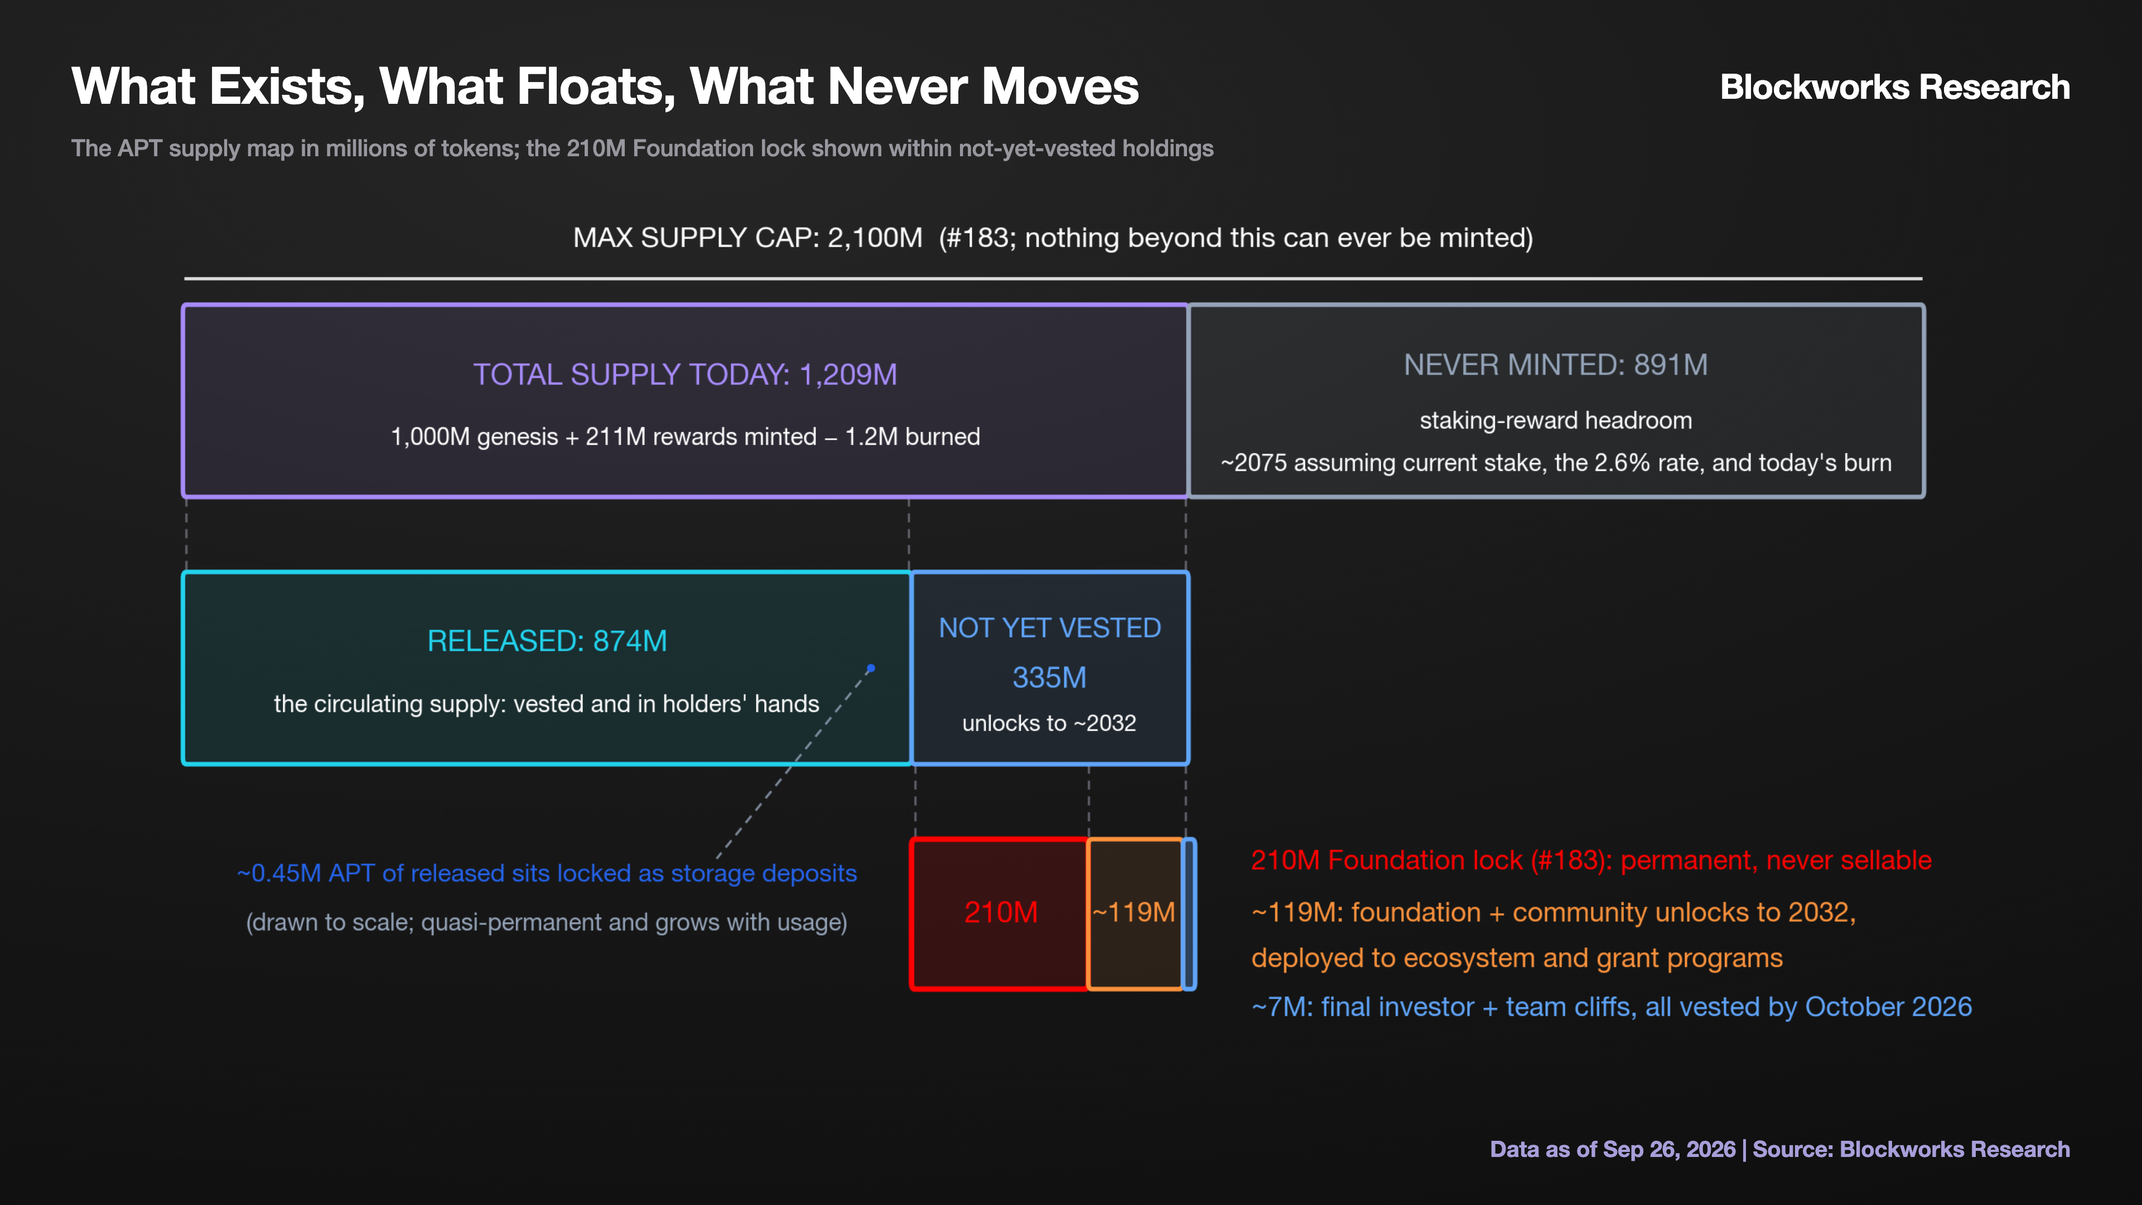
At that pace, minting the 890M APT of headroom below the cap would take until roughly 2075. Whether supply ever gets there depends on whether burn, which grows with demand, catches issuance, which does not.
Transaction Growth
Daily transactions averaged ~4.5M through mid-March and ~10M since, peaking at 16.6M in early July, all at 10x the old fees. The mix improved as much as the level. Through early 2026 much of the activity was incentive-campaign traffic paying near-zero fees and failing more frequently; at 10x prices it stopped making sense and left, costing the network almost nothing, while revenue rose ~14x on the volume that replaced it.
The largest source of that paying demand is Decibel, the perps exchange incubated by Aptos Labs, live since late February. It runs entirely onchain: order book, matching, margining, and liquidations all execute as Aptos transactions, so every order placed, cancelled, or filled burns gas and is verifiable. Within months it became the network's dominant transaction source, validating the design choice made years ago: build for machine-speed execution and let usage, not fee auctions, carry the economics.
Growth has been fast, with cumulative volume reaching $7.5B in seven months. Listed perpetual markets span crypto majors, commodities, and 24/7 stocks, with the feature set of the leading venues: cross-margin, take-profit and stop orders, and vaults that let depositors fund market making.
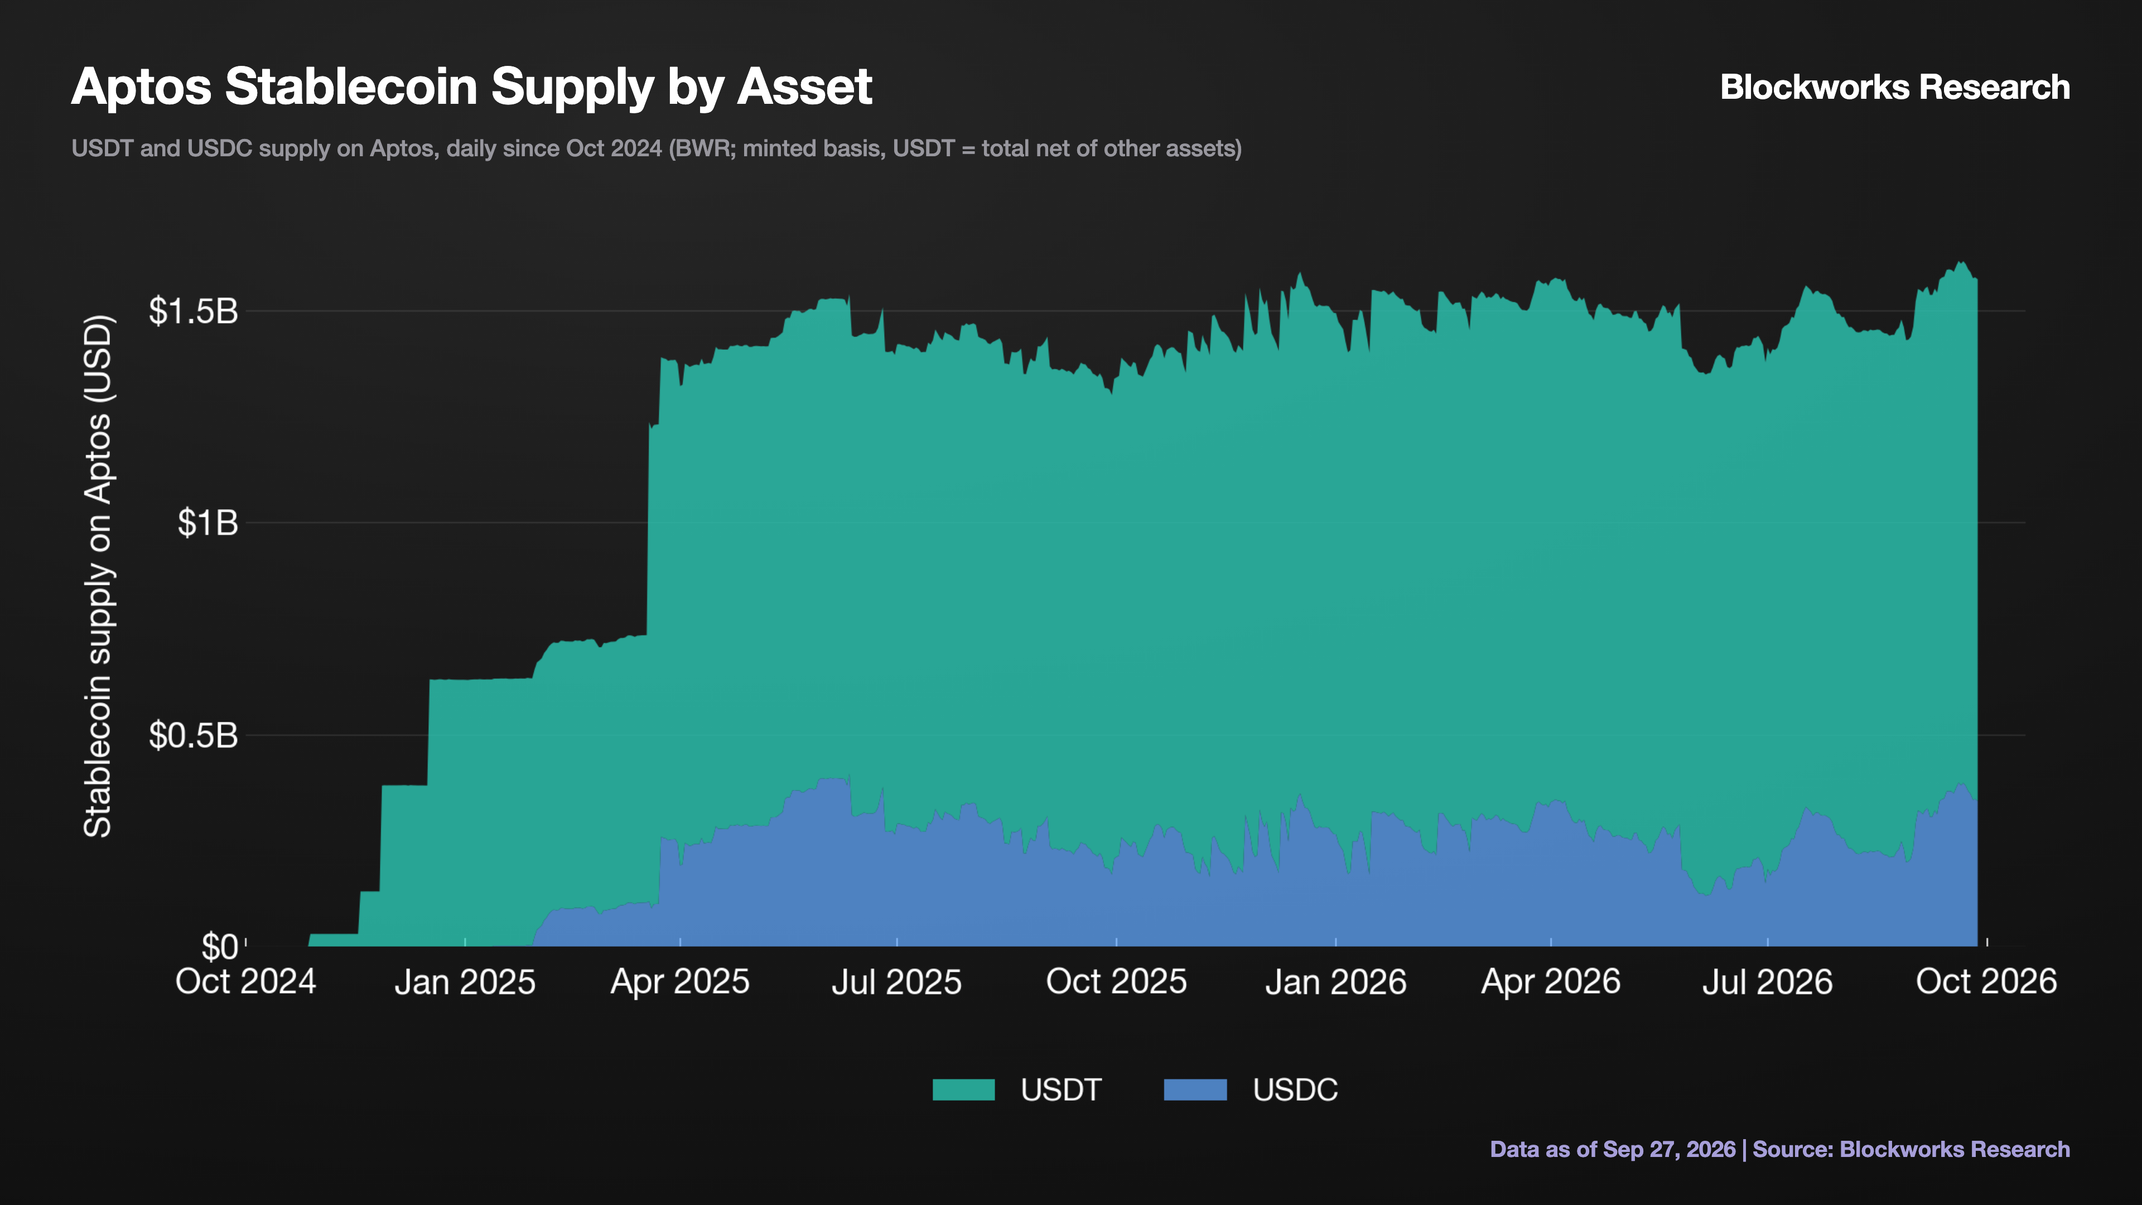
The watch item beyond trading is payments. Aptos carries roughly $1.6B of stablecoin float, and the plumbing keeps building: native USDT, Circle's USDC with Stripe integration, Mastercard's partner program. Transfer counts are small today, but the float is already in place, and any growth in payments activity would add to the same burn.
The Path to Deflation
The previous section showed where the volume comes from. This one asks how much of it the mechanism needs, the math connecting transaction activity to net supply, and the answer reduces to two moving parts:
- Issuance: 2.6% staking reward rate × ~773M staked ≈ 20M APT minted per year. Against the 1,210M total supply, that is +1.7% annual supply growth if nothing is burned and the staked amount stays constant.
- Burn: averaged over the current transaction mix, nearly all of it order-book flow, each transaction burns ~0.00058 APT; over the trailing 30 days that produced ~1.9M APT of annualized burn against ~$39M/day of Decibel volume, or ~135 APT per $1M traded.
A dollar traded through Decibel's book burns on average ~50 times more APT than a dollar swapped through a pool, since every order-book operation is its own gas-paying transaction while an AMM swap is a single one. That intensity is why Decibel accounts for over half of Aptos's trading dollars but 98% of its transactions, and why running it fully onchain is only economic at Aptos's fee and throughput levels.
Today's ~$39M per day of order-book volume produces enough burn to offset about 10% of issuance. Assuming growth in Decibel-like activity at today's transaction sizes, roughly ten times that activity covers issuance entirely and net supply growth reaches zero. Past that point APT turns outright deflationary. The graph below sweeps that relationship across transaction levels.
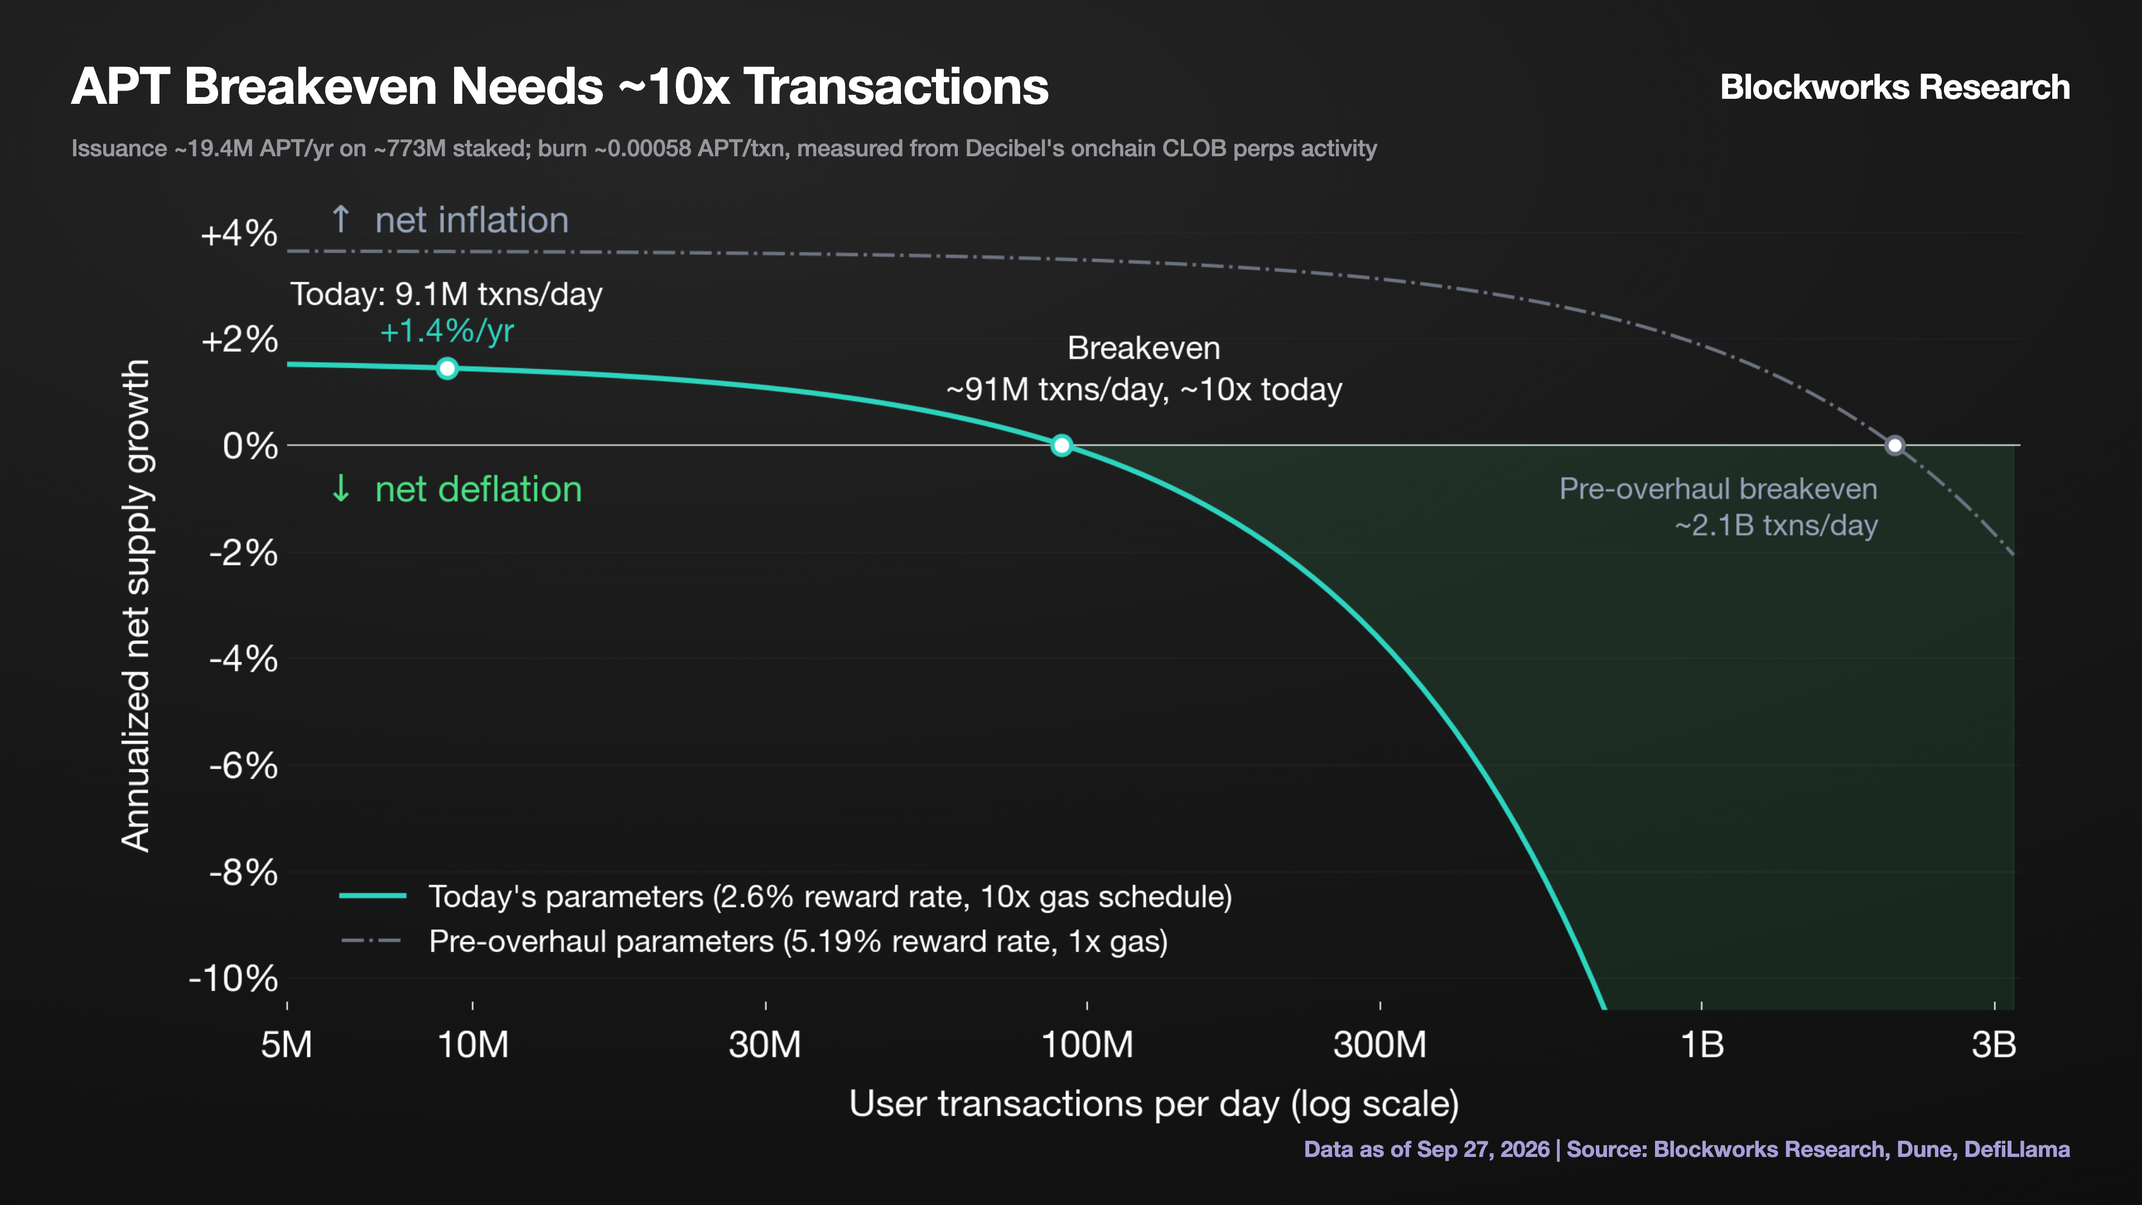
The overhaul is what puts breakeven in reach. Under the old parameters, 5.19% rewards against one-tenth the fees, it sat near 2.1B transactions a day on our estimates, more than 20x further out.
For context, breakeven's ~91M transactions a day is about $390M of order-book trading at today's transaction sizes, roughly 2% of what onchain perp venues clear daily. However, larger venues generate fewer transactions per dollar (order flow scaled by volume to an exponent between 0.5 and 0.7, measured from Decibel's own growth, risk-engine load held fixed), so a Lighter-sized book (~$1B a day) implies ~30 to 50M transactions, a third to a half of breakeven, while a Hyperliquid-sized one (~$6.5B) implies ~70 to 170M, a range that reaches breakeven and breaks into outright deflation.
Capacity is not the constraint. Aptos runs about 105 transactions per second today, and breakeven, the activity level at which burn matches issuance, works out to ~1,050 per second on Decibel-like activity. The mainnet has already demonstrated 13,400 TPS. Lab results point higher still, 160K in single-node tests and ~1M on the sharded testbed.
L1 Comparisons
Set against the other majors, Aptos's fee routing is the outlier. Ethereum burns its base fees, but the trailing-30-day burn covered just ~1.5% of issuance, with priority fees going to proposers and MEV splitting across the builder pipeline. Solana burns half of a fixed base fee and pays priority fees to the block-producing validator. Sui has no direct burn; fees fund staking rewards alongside subsidies from the genesis 10B.
Aptos alone burns the full gas charge and routes nothing to validators, who are paid purely from issuance. The THNI comparison below, using the definition from the Token Holder Net Income section above, puts these designs on level footing. Fee value that reaches stakers on Ethereum, Solana and Sui counts towards THNI just as the burn does on Aptos, so the metric does not favor the burn model by construction.
Even on that basis, Aptos runs the highest THNI of the four by a wide margin, being the only one consistently positive. The graph below shows THNI per $10,000 of FDV. In January 2025, Ethereum’s THNI was about $42 a year per $10,000 and Solana several times that, while Aptos ran too deep in the red to enter the chart until September. By August 2026 the ranking had inverted: Ethereum at negative $0.67, Sui at negative $5.67, Solana now just above zero at positive $0.15, and Aptos at positive $4.21.
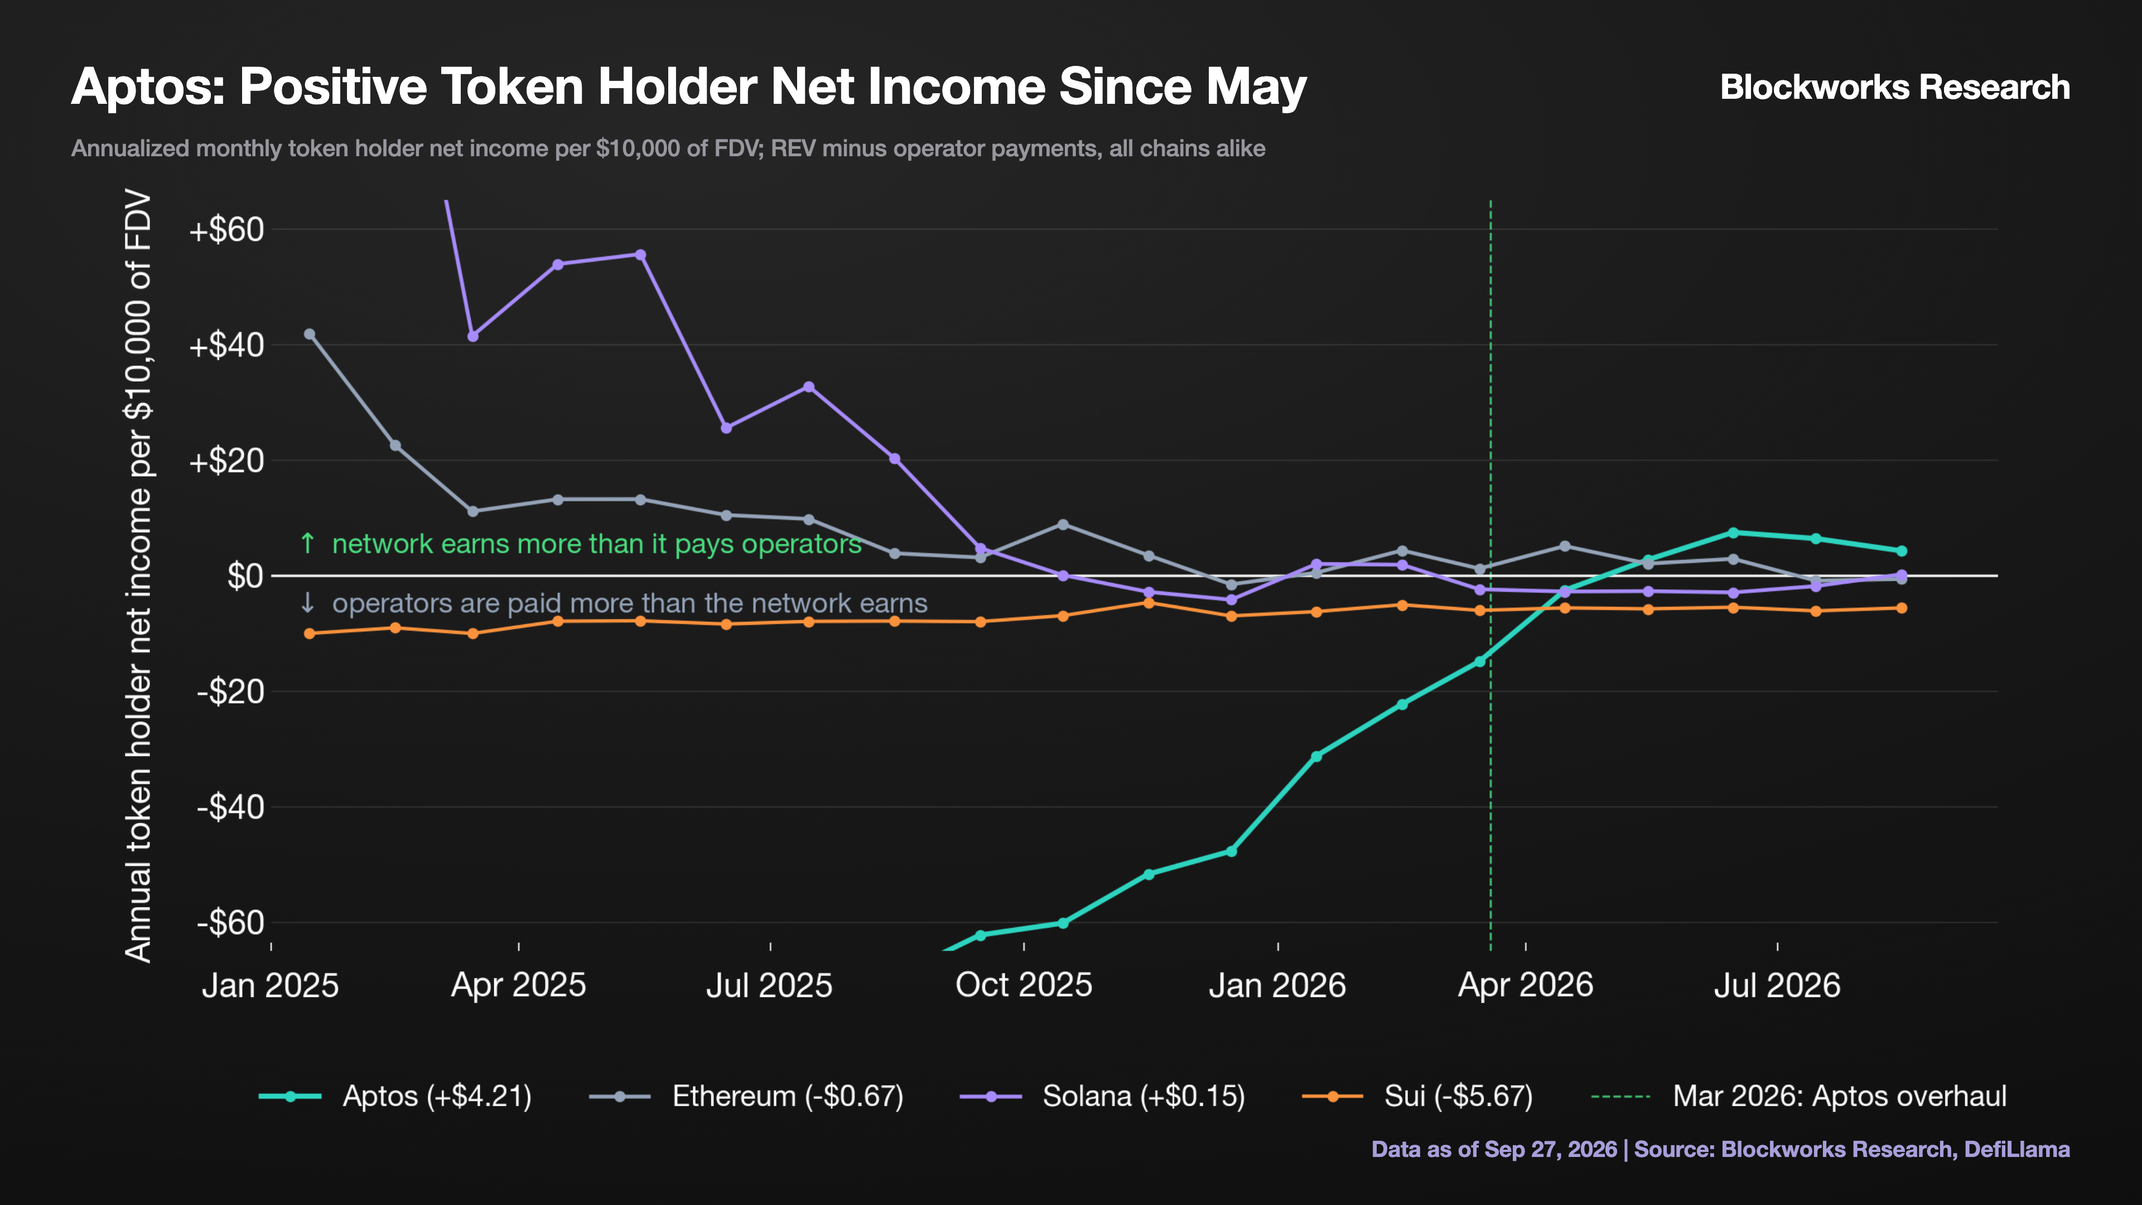
The absolute picture is early, but its two drivers, the design that routes value to holders and the activity that generates it, are both still compounding. Within a year Aptos went from paying operators more than it burned to the inverse, setting a trajectory where network usage and value accrual now rise together.
Outlook and Conclusion
From here, with investor and core contributor unlocks ending in October and the 210M lock never vesting, yearly unlock flow falls from ~135M APT to roughly 21M. On the demand side, the core driver keeps expanding, with Decibel's roadmap adding spot, more equity perps, and portfolio margining, each feeding the transaction flow that drives the burn. AIP-140, the February proposal behind the overhaul, also queued what could come next: duration-weighted staking rewards, a potential Foundation-funded protocol buyback program or reserve, and KPI-vested grants.
The framework for how far those levers can go is the Laffer curve. Network revenue is zero when blockspace is free, rises as the tax climbs while demand holds, and dies once fees start choking usage. So far, gas fees have increased 10x, demand doubled anyway, and fees still amount to a small fraction of the value moved. Everything left is unused room on the curve that can be spent as platform demand deepens.
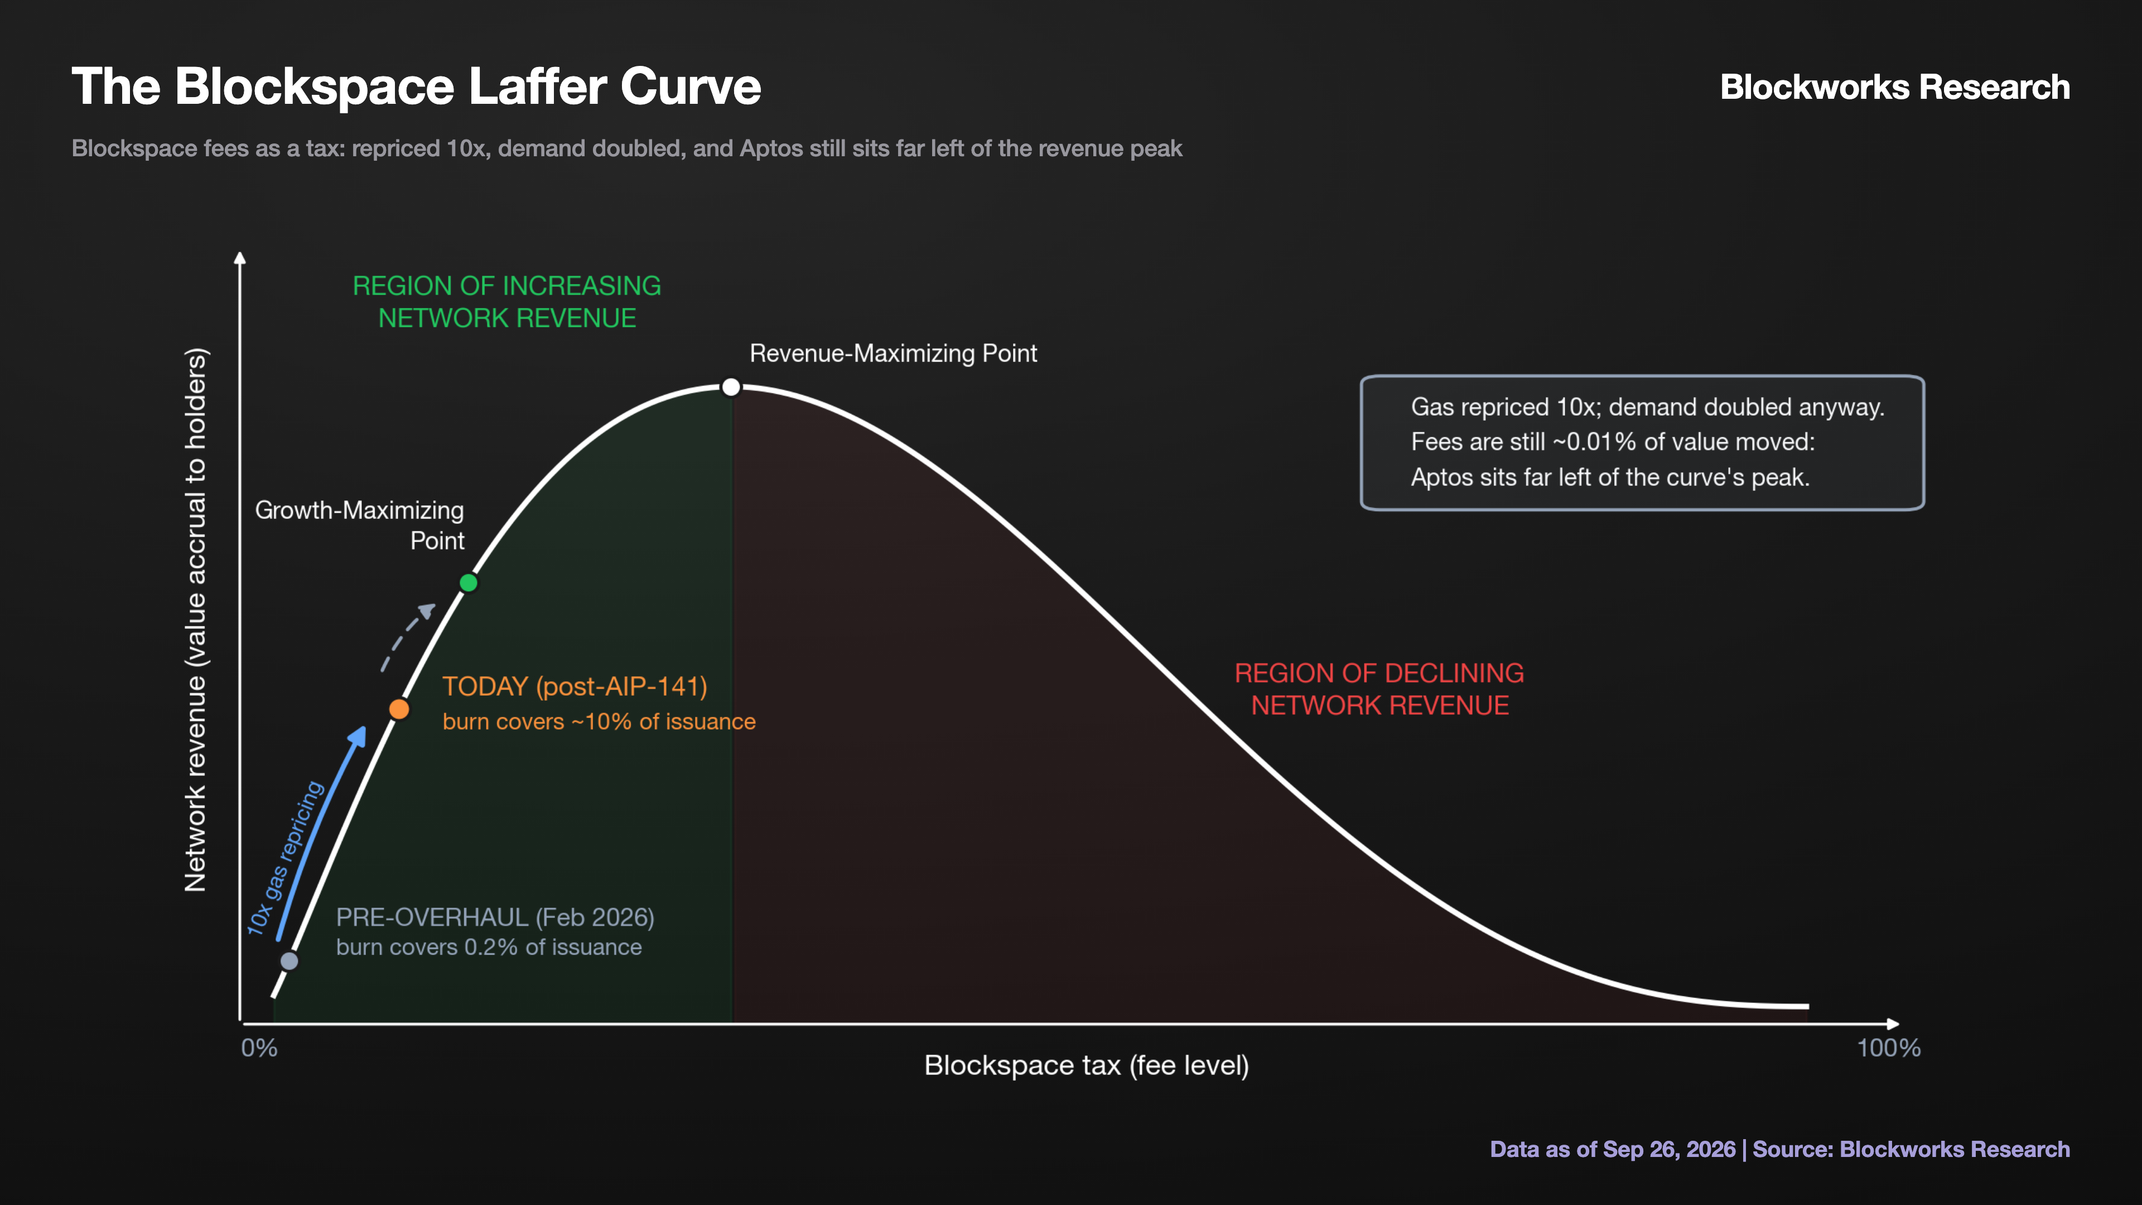
The first step up the curve has already paid for itself: net supply growth fell by roughly 70%, and THNI turned positive. The simplest gauge of progress from here is burn as a share of issuance, up from 0.2% in January to near 10% today, with every increment of demand moving APT closer to deflation.
Disclosure: This research report has been funded by the Aptos Foundation. By providing this disclosure, we aim to ensure that the research reported in this document is conducted with objectivity and transparency. Blockworks Research makes the following disclosures: 1) Research Funding: The research reported in this document has been funded by the Aptos Foundation. The sponsor may have input on the content of the report, but Blockworks Research maintains editorial control over the final report to retain data accuracy and objectivity. All published reports by Blockworks Research are reviewed by internal independent parties to prevent bias. 2) Researchers submit financial conflict of interest (FCOI) disclosures on a monthly basis that are reviewed by appropriate internal parties. Readers are advised to conduct their own independent research and seek the advice of a qualified financial advisor before making any investment decisions.[1]
[1] The Aptos Foundation did not draft and is not responsible for the report's conclusions, methodology, or metrics, including THNI, which is a Blockworks Research metric applied independently across Blockworks' coverage of multiple networks.
