Ethereum active addresses have doubled YTD as DeFi continues rapid growth

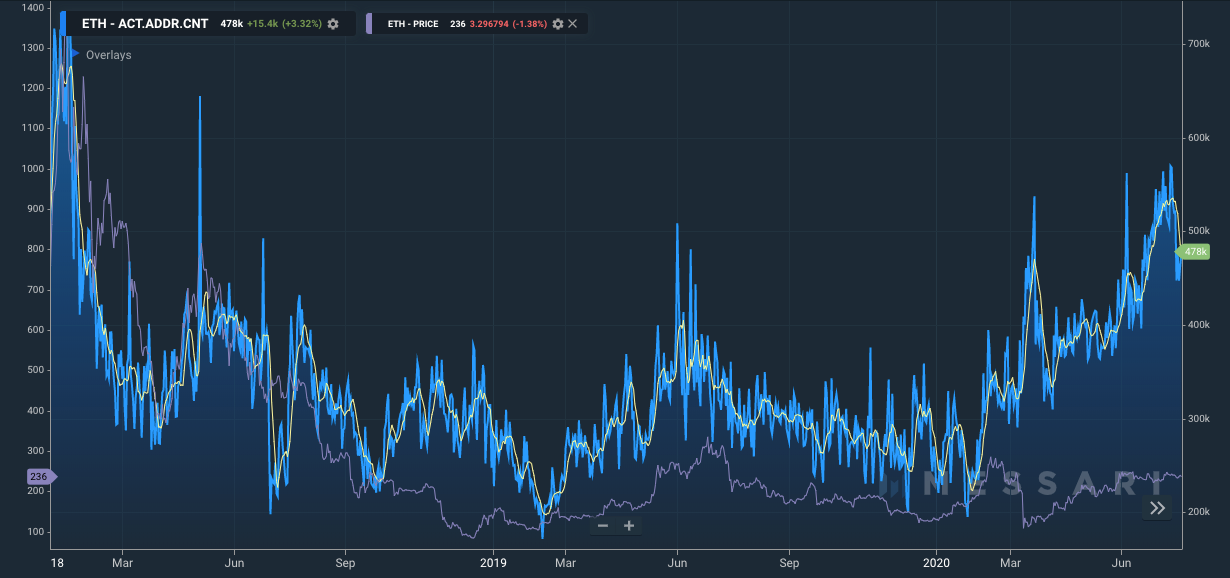
A few weeks ago, Ethereum’s active address count topped 500k (on seven-day moving average) for the first time since the backend of the ICO craze. Active addresses represent the number of unique addresses that either sent or received crypto daily. In this case, it helps estimate how many users interact with Ethereum on a given day (although caveat this with the fact a single user can control multiple addresses).
See the interactive chart here
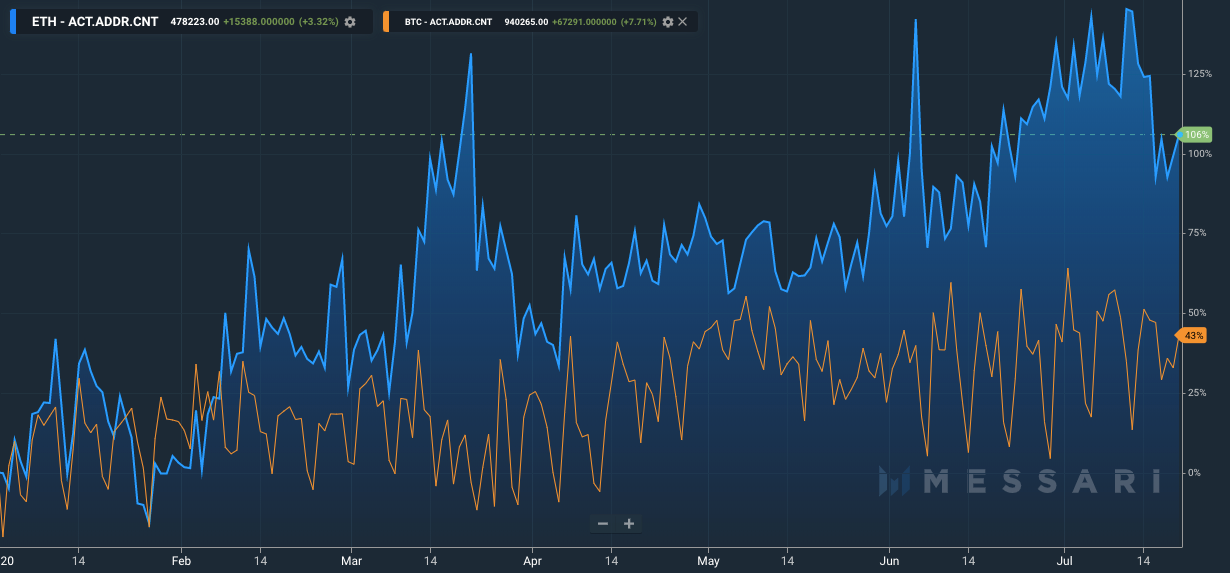
As a result of this recent surge in unique user activity, Ethereum’s daily active address count has doubled YTD and is now outpacing Bitcoin’s on a percentage basis.
See the interactive chart here
The development is yet another sign of growth within the DeFi sector, which had a breakout quarter by nearly every metric. Users are likely rushing to acquire some of these high-flying DeFi tokens and participate in the liquidity mining phenomenon. While frenzies like this are often short-lived, an influx of new users hauling in their bags might give DeFi projects enough liquidity and time to refine their products so they can hang on to most of their users should a day of reckoning arrive.
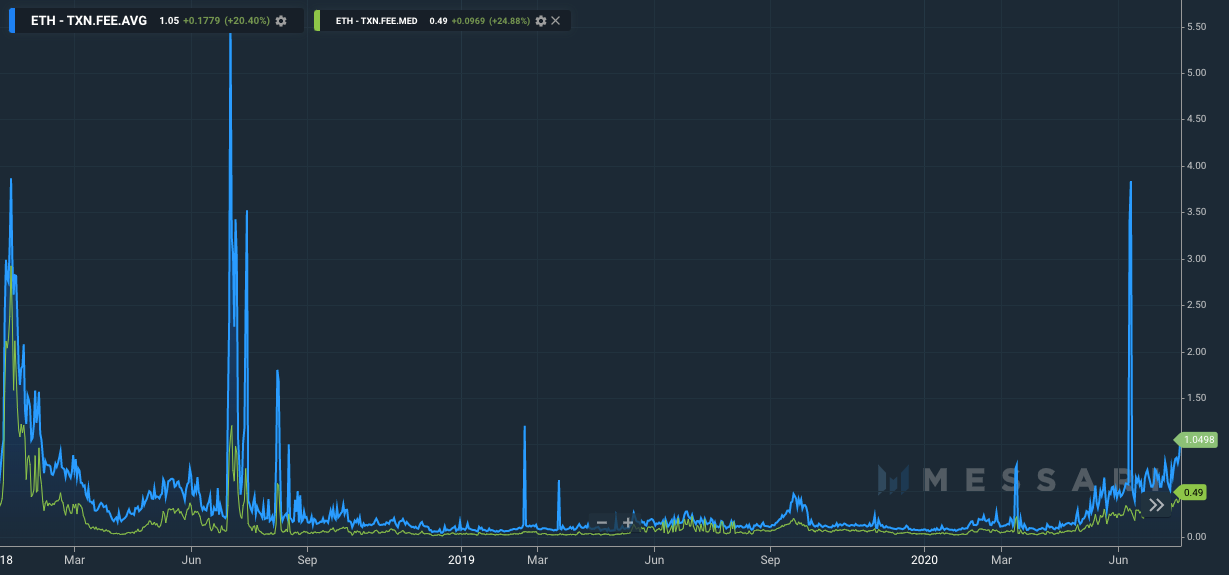
Over the last week, however, the active address count has dropped slightly, as pointed out by CoinMetrics. This dip is possibly in response to the continued rise of Ethereum transaction fees. Sure, rising gas costs signify a high demand for block space and add to the network’s overall security budget. But high fees can make for a poor UX, especially for those transacting in small amounts. Prohibitively expensive transactions can ward off potential users.
See the interactive chart here
Why this matters
- Will this increase in DeFi related activity eventually benefit ETH? As we’ve previously illustrated, not necessarily. ETH will only defend its monetary premium to the extent users demand trust minimized collateral. However, users have increasingly gravitated towards stablecoins over the six months. But there are other catalysts, such as Ethereum 2.0 or EIP-1559, that, combined with DeFi’s progress, could have a positive impact on ETH’s monetary premium.
- The relatively modest growth in Bitcoin’s active address count YTD is not entirely surprising, as BTC has traded range-bound between $9,000 and $10,000 for most of the last two months.